
Figure 5.
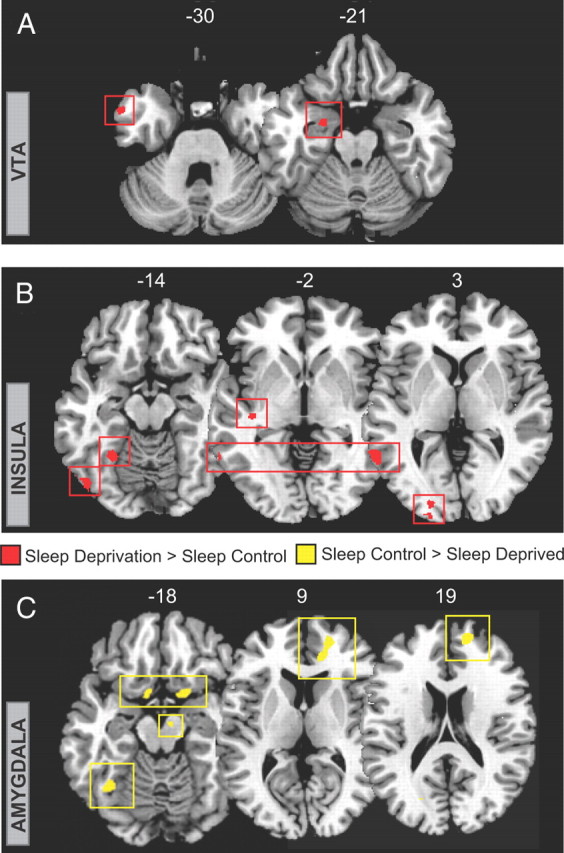
Group-level differences in functional connectivity. A, B, Regions showing significantly greater functional connectivity (red with red box surround) in the sleep-deprivation group relative to the sleep-control group for ROIs in the VTA (seed), in the left anterior temporal pole (MNI peak: −57, 6, −30; Z score = 3.74) and left amygdala (peak: −24, −6, −24; Z score = 3.93) (A); and the insular (seed), in the left lateral occipital cortex (peak: −48, −75, −9; Z score = 3.63), medial fusiform gyrus (peak: −27, −54, −15; Z score = 3.98), posterior insular cortex (peak: −39, −24, −3; Z score = 4.02), posterior middle temporal lobe (peak: −63, −54, 3; Z score = 3.88), and left occipital cortex (peak: −21, −102, 3; Z score = 3.82) (B). C, Regions showing significantly less functional connectivity (yellow with yellow box surround) in the sleep-deprivation group relative to the sleep-control group for bilateral amygdala ROIs in (left seed) the left orbitofrontal cortex (peak: 18, 9, −18; Z score = 4.12), right orbitofrontal cortex (peak: −9, 6, −15; Z score = 3.51), medial prefrontal cortex (peaks: 15, 54, 18, Z score = 4.02; 21, 51, 6, Z score = 3.71; 15, 39, 9, Z score = 3.42), left fusiform gyrus (peak: −36, −57, −18; Z score = 3.72), and (right seed) the midbrain (peak: 9, −12, −18; Z score = 3.35). Images are displayed in neurological convention on T1 anatomical axial slices (MNI slice number above), with left side corresponding to left hemisphere.