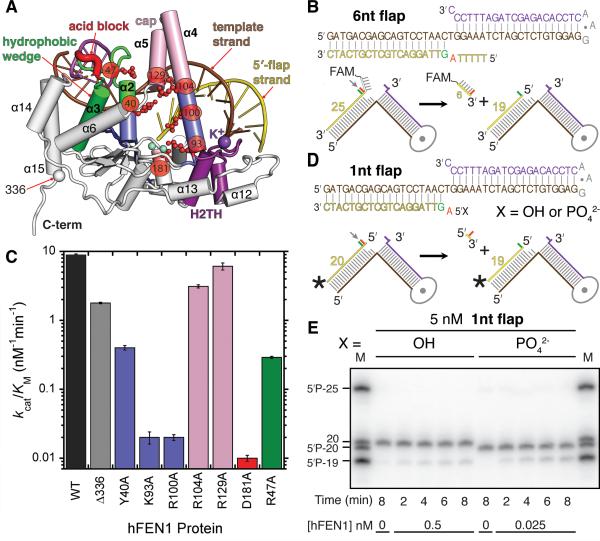
Figure 5. Structure–Guided Site-Directed Mutagenesis of Active Site, Helical Gateway, Hydrophobic Wedge and Helical Cap Residues.
(A) FEN1:Sm3+:product complex fold (ribbons) marking the position of mutations in this study (colored as in Figure 1).
(B) Substrate used in (C) with schematic of the incision.
(C) Catalytic efficiency of WT and mutant FEN1 as bar graph showing the relative severity of mutations. Controls and examples of data are in Figure S3.
(D) 5′ -phosphate substrates used in (E) with schematic of the incision.
(E) Denaturing PAGE gel showing increased incision activity on substrates with a 5′-phosphate at the +1 position.

