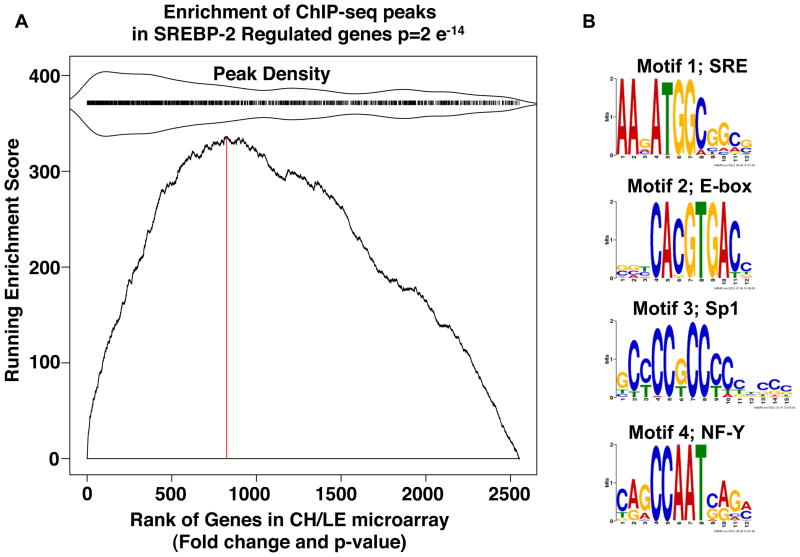
Figure 3. Analysis of SREBP-2 peaks.
(A) Gene Set Enrichment Analysis: KS plot. The gene list for the ChIP-seq peaks that were located within 20 kb of a known gene was compared for their correlation to expression of all mouse genes rank ordered for degree of differential expression in RNA isolated from livers of mice fed chow supplemented with LE versus chow supplemented with cholesterol as described in Experimental Procedures (Subramanian et al., 2005). All genes that were expressed based on the microarray (~2.5 × 10⁴) were ranked by fold difference and p value (x-axis) and the graph plots the running enrichment score on the ordinate. Here, many of the genes from the ChIP-seq data set were located in the highly differentially expressed portion of the micorarray data set indicating the genes identified by the ChIP-seq analysis are differentially expressed in the liver of LE vs cholesterol fed mice (p-value =2×e−14). The red vertical dotted line is drawn at the microarray gene index corresponding to the maximum enrichment score (ES). Genes with a corresponding adjacent peak have a tick mark above the main plot. To indicate relative enrichment of the peak regions, peak region density is mirrored around the tick marks as indicated. (B) Web Logos for Motifs present in SREBP-2 ChIP-Seq Peaks. Four motifs were identified by running MEME on the 1800 peak sequences. Motif 1 occurred in 892 of the peaks (E-value = 1.4×10−278), motif 2 occurred in 193 of the peaks (E-value = 2.1×10−070), motif 3 occurred in 231 of the peaks (E-value = 7.8×10−047), and motif 4 occurred in 148 of the peaks (E-value = 1.4×10−031)

