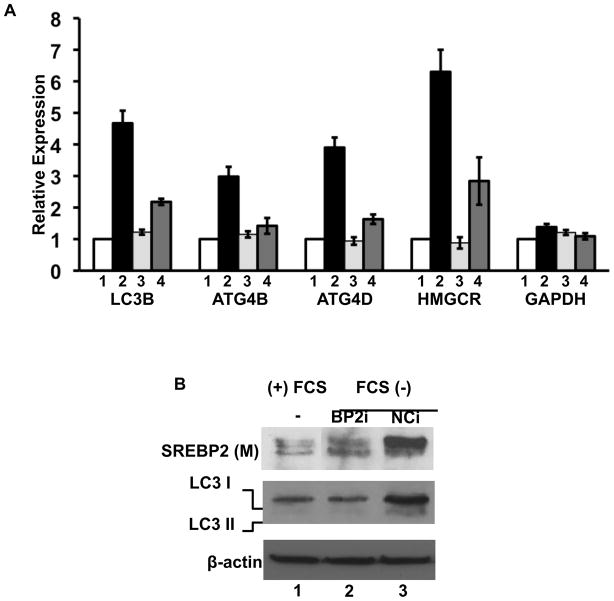
Figure 4. SREBP-2 regulates autophagy-related gene expression.
(A) 293 cells were transfected with an siRNA (10 nM) for a negative control siRNA (lanes 1 and 2) or siRNA targeting hSREBP-2 (lanes 3 and 4). Twenty-four hours after transfection, cells were cultured in 5% lipoprotein deficient media (LPDS) lanes 2 and 4 or LPDS plus sterols (12 μg/ml cholesterol and 1 μg/ml 25-hydroxycholesterol) for 24 h. and harvested for RNA or total protein (Sanchez et al., 1995). (A) mRNA levels for LC3B, ATG4B, ATG4D, HMGCR and GAPDH were analyzed by RT-qPCR and relative expression is plotted. (B) Whole cell lysates were analyzed for SREBP-2 or LC3 protein levels by immunoblotting. Data are representative of 3 separate experiments. Data are mean ± SEM; n = 3 for 3 separate experiments. HMGCR, HMG Co-A reductase; BP2i, SREBP-2 siRNA; NCi, negative control siRNA.

