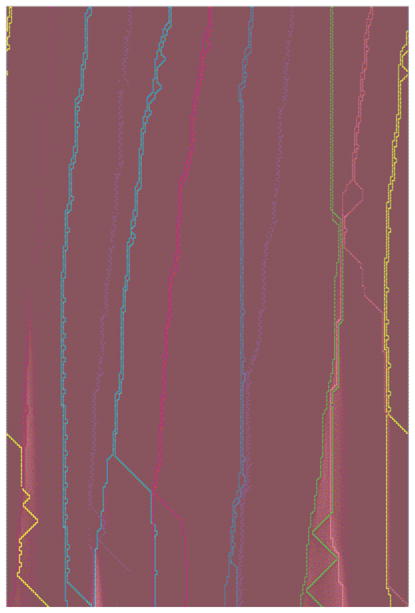
Figure 1.

Screenshot of a simulation using the default parameters. The simulation begins at the top and the world (a horizontal line with 201 locations) and agents move down as time progresses, leaving a visual record of their movement over time. Offspring are initially placed in the patch immediately to the right of their parents (at the top of the figure), and after that parents and offspring move according to the schedule and rules described below. Parents emit energy every time period in the patch immediately to their right, and offspring consume this energy. Remaining energy diffuses over time, and patches with energy (resources) on them are indicated by a lighter pink hue.
