Figure 4.
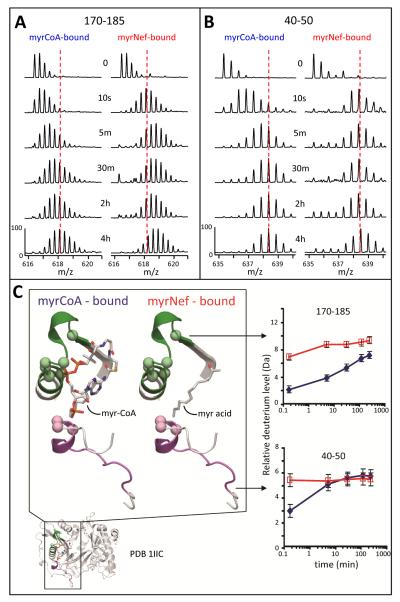
Deuterium uptake in the NMT myristoyl coenzyme A binding pocket. (A) Mass spectra of the peptide covering residues 170-185, m/z 616.39 (+3), for both the myrCoA- and MyrNef-bound states. (B) Mass spectra of the peptide covering residues 40-50, m/z 635.32 (+2), for both the myrCoA- and MyrNef-bound states. In panels A and B, the amount of time in D2O is indicated in the center and the dashed red line, meant as a visual reference, is drawn through the centroid value of the isotope distribution of each peptide at the myrCoA-bound 4 hour time point. (C) Structural location and deuterium uptake of the two peptides from panels A and B. Peptide 170-185 is shown in green and 40-50 in purple. Myristoyl coenzyme A and the myristoyl moiety of MyrNef are indicated. Backbone amide hydrogens which hydrogen bond to the phosphate groups of myrCoA are shown as space filling balls. The deuterium uptake curves for these two peptides, as measured from the spectra in panels A and B, are the average of two independent experiments (error bars are set to ±0.5 Da). The myrCoA-bound state is shown in blue and the MyrNef-bound state in red. See also Supporting Information Figures S5 and S6.

