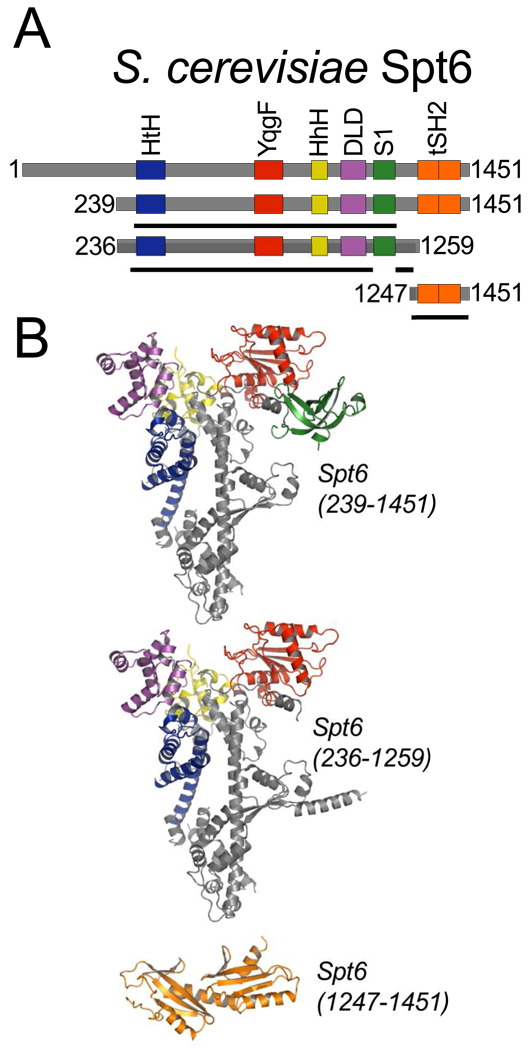
Figure 1. Spt6 structures.
(A) Schematic representation of full-length (top) Spt6 and constructs used for crystallization. The three crystallized constructs (239–1451, 236–1259, and 1247–1451) are shown below, with solid black lines indicating regions of the protein constructs visible in each of the crystal structures.
(B) Three independently determined Spt6 crystal structures colored by domain as in (A).

