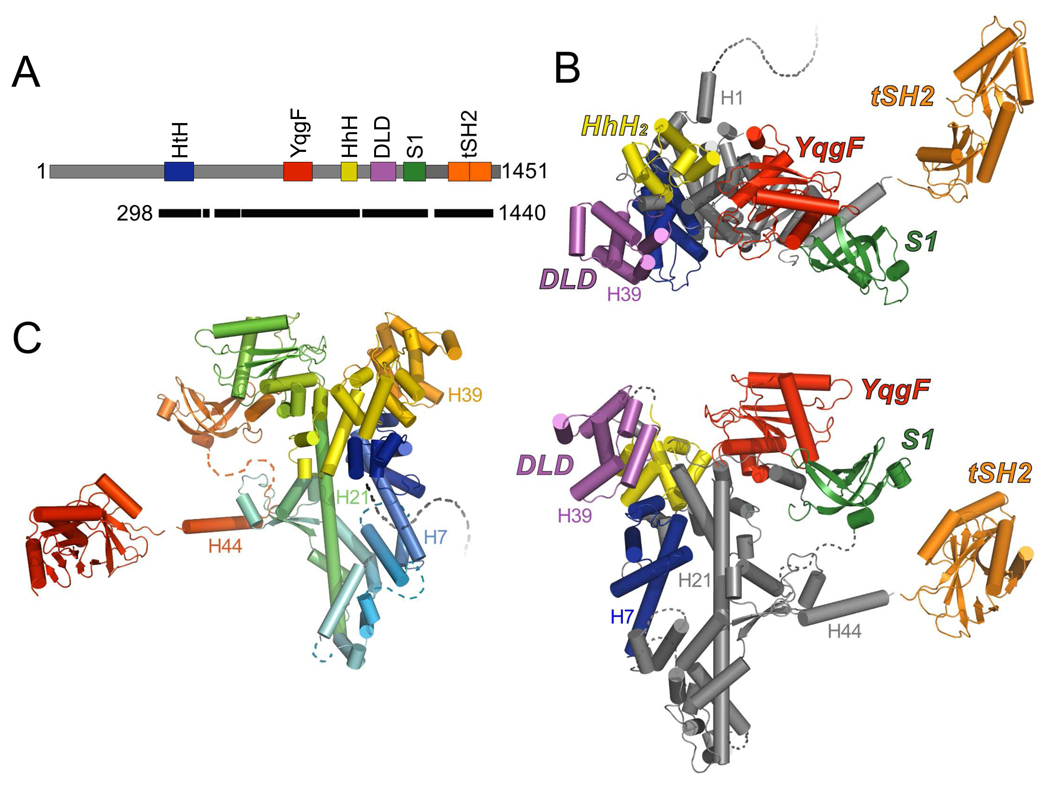
Figure 2. Composite model of Spt6.
(A) Schematic model of the Spt6 protein as in Figure 1A. Black bar indicates segments of the protein represented by the composite model.
(B) Two views of the composite model of Spt6 colored by domain. The C-terminal ~200 residues (tSH2 domain) are expected to be highly mobile with respect to the core. Secondary structure elements mentioned in the text are labeled. Dashed lines represent regions of the Spt6 protein that are not visible in our structures and are likely to be disordered, including the first 297 residues.
(C) Composite model of Spt6 colored from N to C terminus (blue to red). View orientation is rotated 180° from that of the lower image in panel B.

