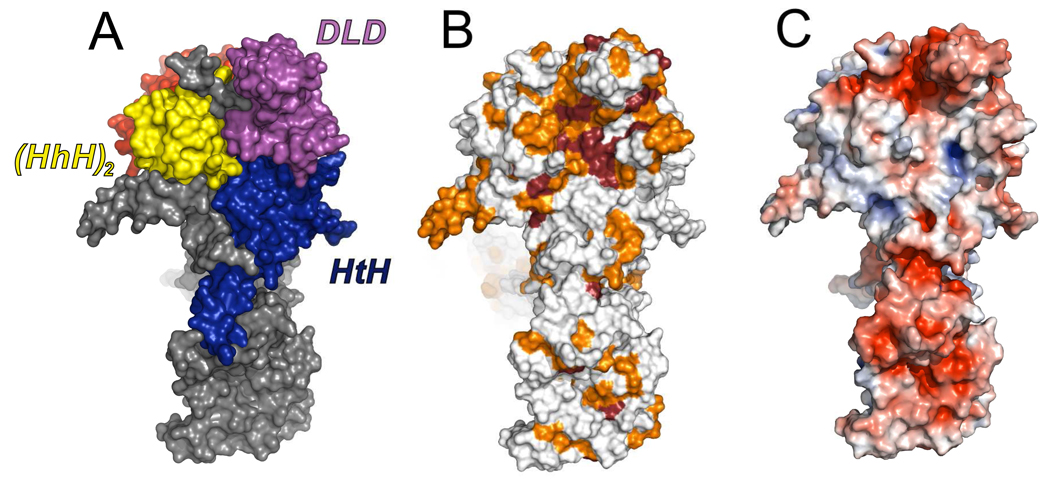
Figure 4. The most conserved surface of the Spt6 core.
(A) View of the Spt6 core showing the interface between HtH, DLD, and (HhH)2 domains.
(B) Same orientation as panel (A) but colored by conservation to illustrate the high level of surface conservation at the intersection of these domains, especially on the DLD. Coloring represents degree of conservation as described in Figures 3 and S1.
(C) Same as panel B, but colored by electrostatic potential (−5 to +5 kT/e).

