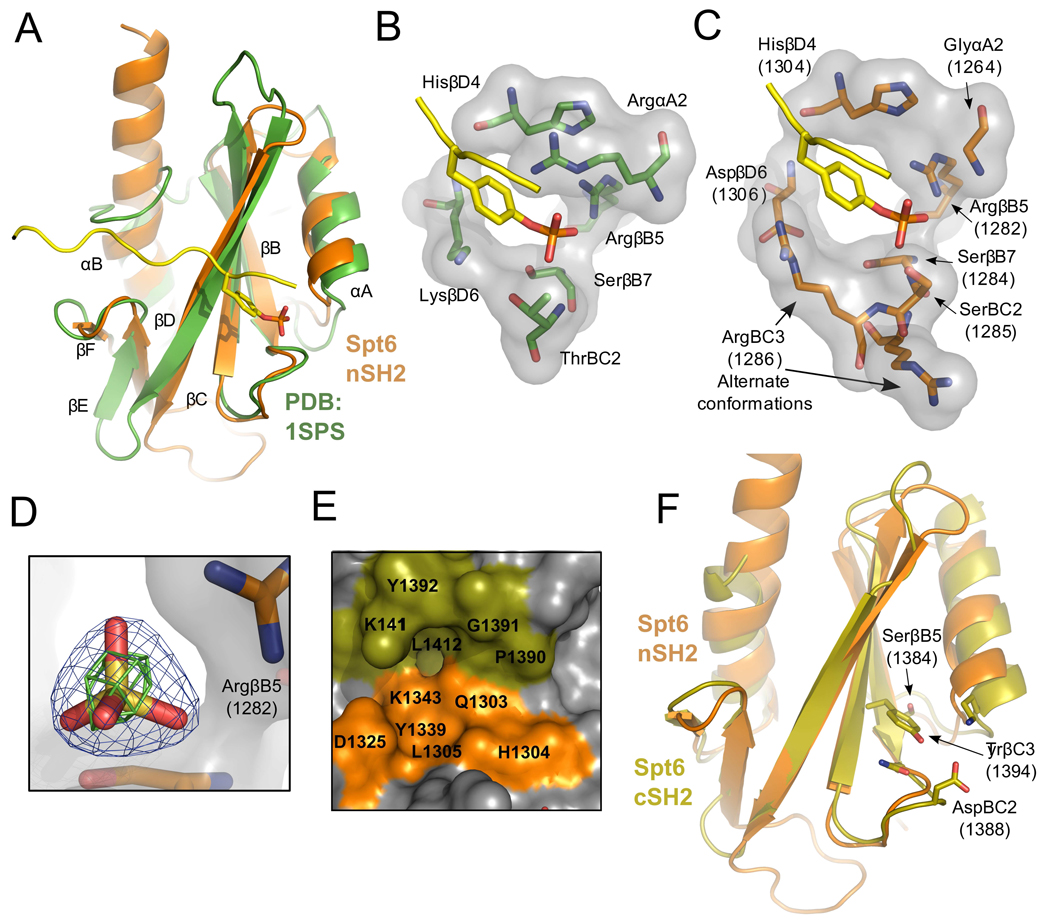
Figure 7. tSH2 binding pockets.
(A) Overlay of Spt6 nSH2 (orange) and the v-Src Kinase SH2 domain (green; pdb:1sps) bound to a pTyr ligand (yellow). Secondary structure elements labeled based using the standard SH2 nomenclature.35
(B) Detailed view of the pTyr binding pocket of 1sps. Residues contributing to coordination of the pTyr ligand are shown.
(C) Same as panel B but for the Spt6 nSH2, with the pTyr peptide from 1sps positioned after overlap on the SH2 protein domains.
(D) Electron density for a sulfate bound in the tSH2 crystal structures. Blue density represents the 2mFo-DFc map contoured at 2.0 sigma and green density an anomalous difference Fourier map contoured at 3.0 sigma.
(E) The putative nSH2 specificity pocket. Residues from both the nSH2 (orange) and cSH2 (olive) line the nSH2 specificity pocket.
(F) Alignment of the Spt6 nSH2 (orange) and cSH2 (olive) folds. Residues that protrude into the typical location of the pTyr binding pocket of the cSH2 fold are shown.

