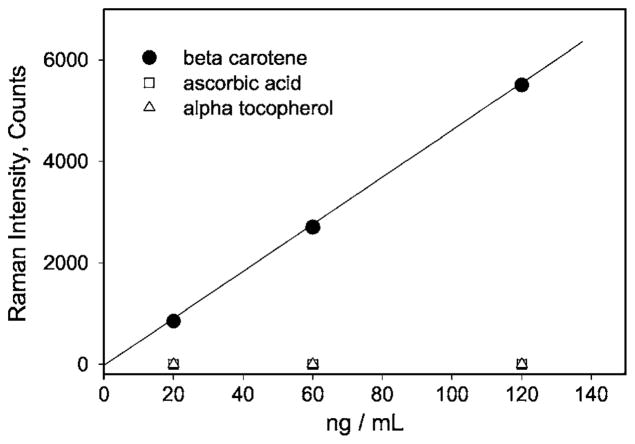
Fig. 4.
RRS responses in the spectral vicinity of the C==C stretching frequency, measured for various antioxidants as a function of concentration in ethanol under identical excitation and detection conditions—●, β-carotene; □, ascorbic acid; ▵, α-tocopherol—from Ref. 13. Note the absence of a Raman response for noncarotenoid compounds.

