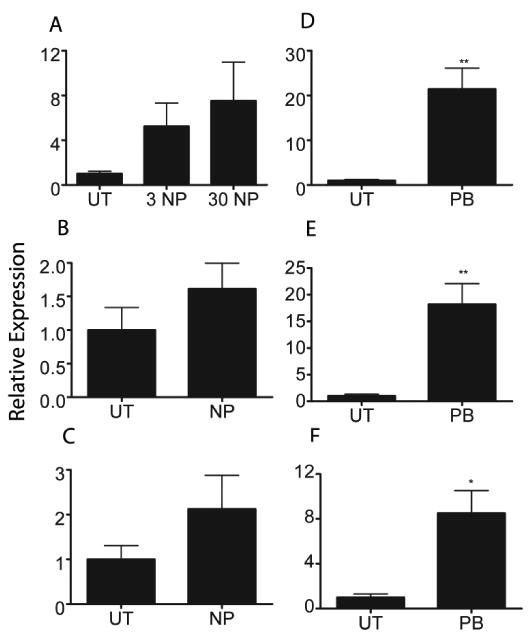
Figure 4.

CYP3A4 expression in human hepatocytes treated with nonylphenol. Q-PCR was performed with human hepatocytes from three different donors treated with NP or PB. A) Donor 1 NP treated hepatocytes. B) Donor 2 NP treated hepatocytes C) Donor 3 NP treated hepatocytes D) Donor 1 PB treated hepatocytes E) Donor 2 PB treated hepatocytes F) Donor 3 PB treated hepatocytes. An asterisk indicates a statistically significant difference compared to the untreated group using Student's t-test (p < 0.05).
