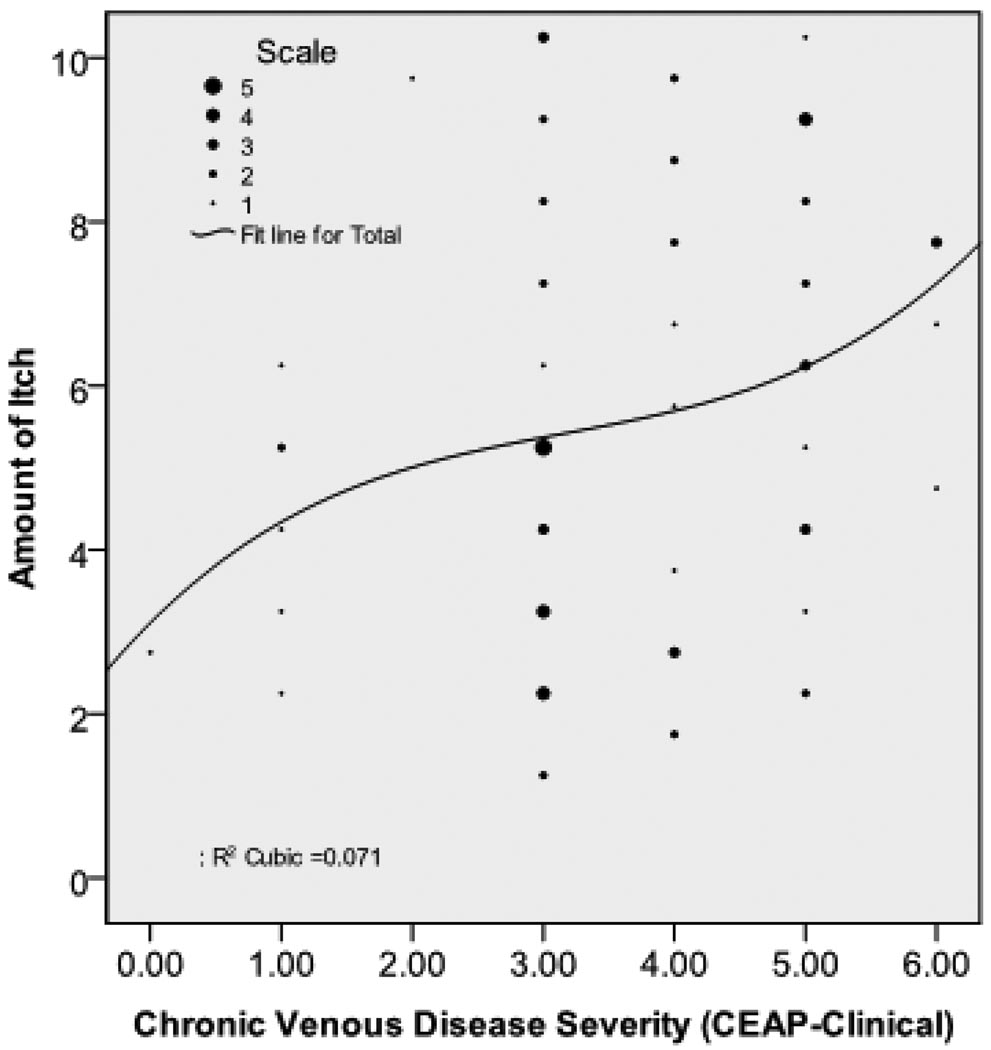
Figure 1.
The figure shows the relationship between leg/feet itch (n = 74) and chronic venous disease severity. The vertical axis is the leg/feet itch score (0 to 10 scale). The horizontal axis is the clinical CEAP score (Class 0 to Class 6). This relationship was not strictly linear with itch increasing at a faster rate at higher levels of clinical CEAP

