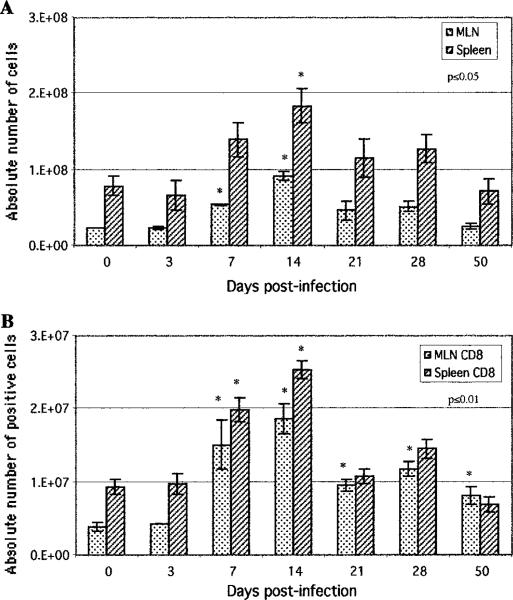
FIGURE 4.
Induction of MLN and splenic response following oral E. cuniculi infection. C57BL/6 mice were infected orally, MLN lymphocytes, and splenocytes were isolated at various time points postinfection and pooled (n = 4 mice per group). A, Absolute numbers of total MLN and spleen cells recovered per mouse were determined for each time point. B, Isolated cells were assayed for CD8 expression by FACS analysis. Data represent the mean ± SD of two individual sets of experiments. Statistical significance between each time point and the uninfected control was determined using the Student t test.

