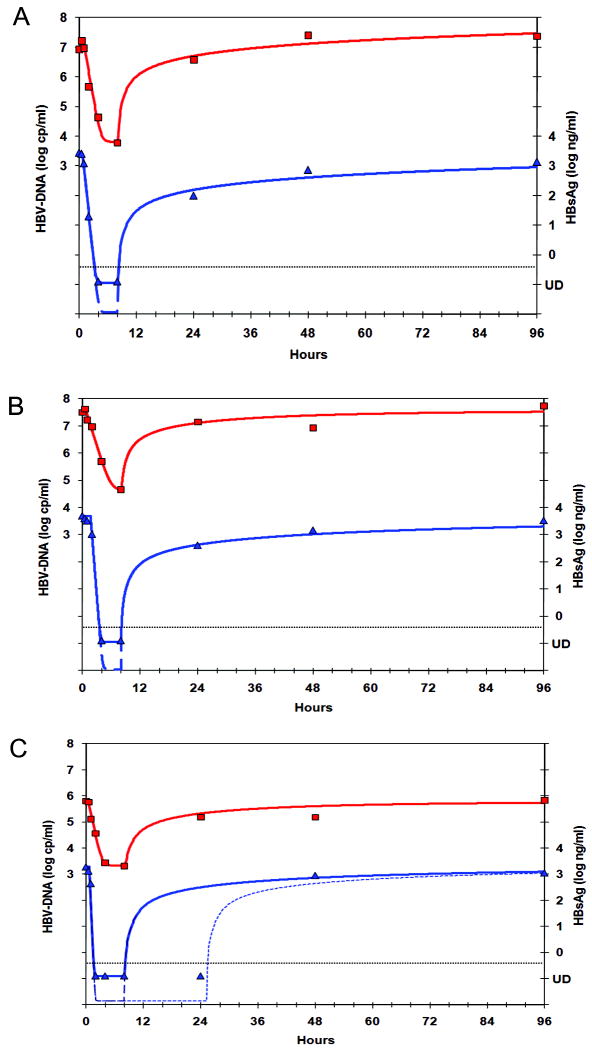
Figure 3. Non-linear fitting of HBV-DNA and HBsAg kinetics with a model assuming a combined effect of blocking virion release together with acceleration of virus clearance from circulation.
This model yields good non-linear fitting simultaneously for HBV-DNA (squares, left Y-axis) and HBsAg (triangles, right Y-axis) in the 3 patients with frequent samples (A-C) and allows us to estimate the viral dynamics parameters (Table 1). Since HBsAg became undetectable in all patients, the equivalent parameters are only minimal estimates corresponding to the solid blue curves, but in fact could be faster (e.g. the dashed curves). In one patient (C) we observe a slower relapse, thus indicating a gradual decline in the effectiveness of blocking viral release (dotted line).

