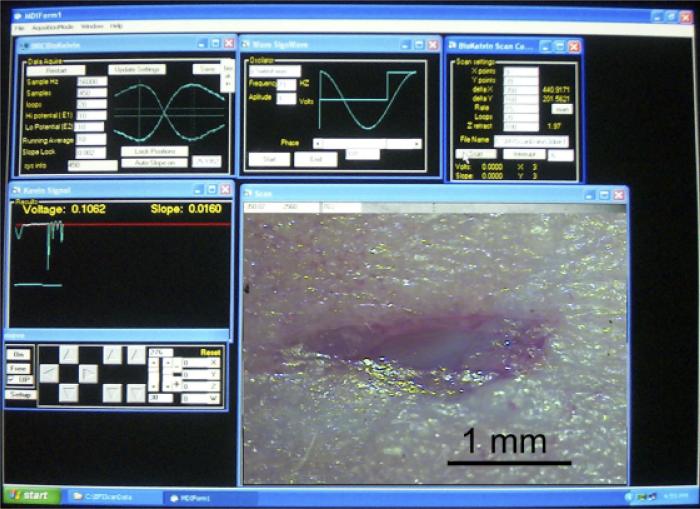
Figure 3.
Photograph of computer screen during a typical scan of a wound. Upper left panel displays real-time voltage signal from the probe and allows the user to select amount of averaging and range of Vb. Upper middle panel allows user to select frequency of vibration and phase of signal analysis. Upper right panel allows user to specify the x–y distribution of the potential measurements to be made, number of loops to be averaged and the file name for data storage. The voltage is plotted in real time in the middle left panel and probe position can be controlled in the lower left panel. Lower right panel displays an image of the wound that is being scanned that was photographed through a stereoscope before scanning.

