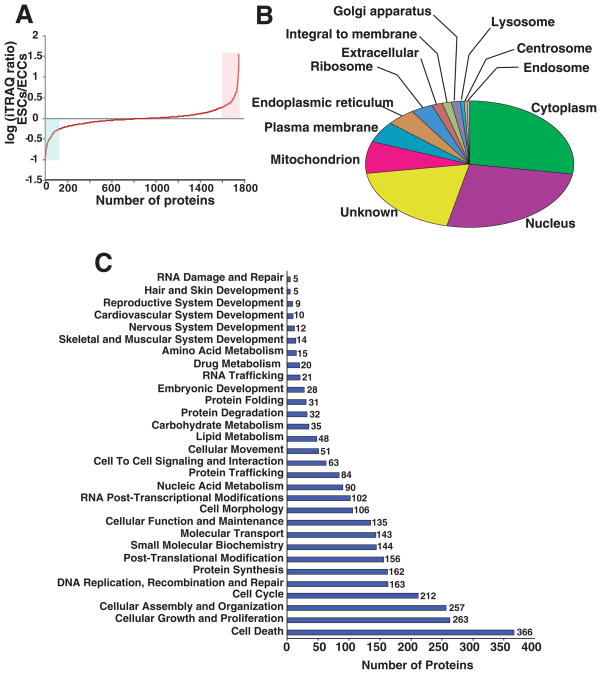
Fig. 3. Localization and functional annotation of proteins identified from ESCs and ECCs.
Panel A shows the distribution of iTRAQ fold changes (proteins expression levels) observed between ESCs and ECCs. Panel B shows the gene ontology analysis for cellular localization of all the proteins identified. Primary and alternate localization data was downloaded from human protein reference database (www.hprd.org) [25] and Panel C shows functional classification of all the proteins quantitated in this study. Using Ingenuity pathway analysis tool, proteins justifying specific biological function significantly (p <0.05) are listed.

