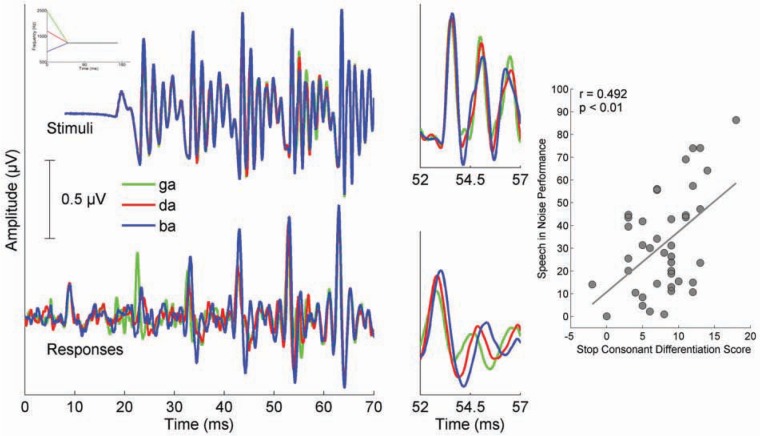
Figure 2.
Stimulus timing and responses are presented for /ba/ (blue), /da/ (red), and /ga/ (green) syllables
Note. Time-domain grand average responses for 20 typically developing children (bottom panels) demonstrate timing differences in the response that reflect acoustic differences in the stimuli (top panels). The 52- to 57-ms region of the response is magnified to highlight latency differences that are present in the responses. The scatterplot on the right demonstrates a relationship between subcortical differentiation scores and speech-in-noise performance on the Hearing in Noise Test (HINT; r = .492, p = .001). Modified from Hornickel et al. (2009).

