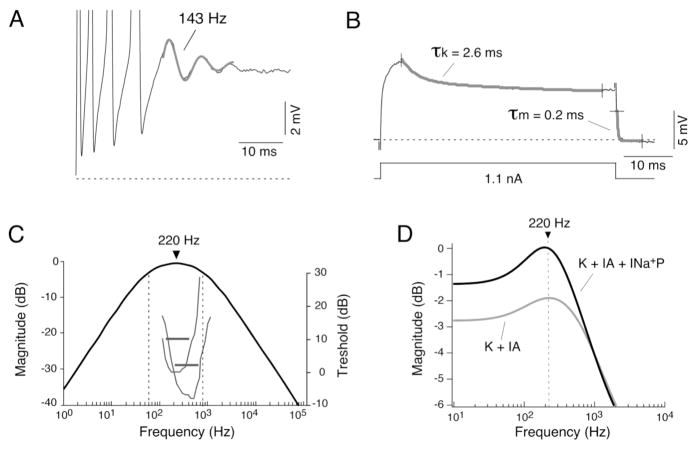
Figure 4. Club ending afferents exhibit resonant membrane properties.
A, Electrophysiological recordings revealed the presence of subthreshold membrane oscillations underlying repetitive responses. Trace illustrates the membrane response to a depolarizing current pulse, consisting of four action potentials followed by a damped oscillation of the membrane potential (trace represents the average of 5 single responses centered in the oscillation; action potentials are truncated). The frequency of this subthreshold oscillation was estimated fitting a function consisting in the sum of a sinusoidal and an exponential function (143 Hz, thicker trace). B, Indirect estimates of electrical resonance were obtained by calculating cutoff frequencies of the low-pass and high-pass filtering properties of the membrane from kinetics of subthreshold membrane responses. The time constant of a high-pass filter representing the activation of the A-type current (τk) was estimated by fitting a double-exponential function to the decaying portion of the near-threshold response about 5 ms after the pulse onset. Only the faster and most prominent time constant (30 fold the magnitude and 10 times faster than the second one), which likely represents the activation of the A-type current, is represented here and its value used for the estimates of electrical resonance. The time constant of a low-pass filter, representing passive membrane properties (τm), was accurately estimated by fitting a single exponential function to the decay that followed the cessation of current pulses of different polarities and amplitudes (only one of these pulses is illustrated in this example and indicated as τm). This estimate is influenced by both the passive membrane properties and the spread of the injected current along the axon, and represents the effective time constant of the afferent fiber. C, Bode plot (magnitude versus frequency) constructed using a linear model that combines both high- and low-pass filter properties of the membrane. The combination of membrane mechanisms with high-pass and low-pass filtering properties determines a band-pass filter with a bandwidth of 742 Hz and a maximum at 220 Hz. For comparison, the tuning curves of two representative saccular afferents are also illustrated in the same graph (gray traces; curves originally illustrated in Fay, 1995). Threshold in dB (right side ordinates) is plotted against sound frequency. Note that the characteristic frequencies and Q10dB responses (horizontal lines) of both tuning curves (corresponding to the responses of the two types of afferents found in goldfish) matched the estimated bandwidth of the electrical resonance. D, Computer simulations with NEURON revealed the relative contributions of A-type (IA) and persistent Na+ (INa+P) currents to membrane resonance. Based on available anatomical data, an ideal Club ending afferent fiber was modeled as a section consisting of a cylindrical process with passive properties (see Curti et al., 2008). Plot illustrates the computed input impedance (ordinates, normalized to the magnitude of the steady-state membrane response in the absence of any active mechanism) versus frequency (abscissa). When a delayed rectifier and an A-type current with the kinetics estimated experimentally for the ventral cochlear nucleus (Rothman and Manis, 2003) were added to the model, a clear resonant behavior appeared centered at 220 Hz (K + IA, gray trace). Note that the addition of a persistent Na+ current produces a significant amplification of the membrane resonance (K + IA + INa+P, black trace), without modifying the resonant frequency. Modified from Curti et al. (2008), with permission.

