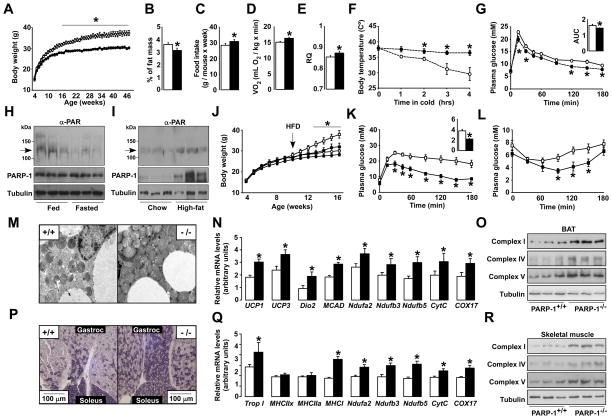
Figure 1. Phenotyping the PARP-1−/− mice.
(A) Body weight (BW) evolution in PARP-1+/+ and −/− mice (n=8/9). (B) Epidydimal white adipose tissue mass. (C) Average food consumption. (D) O2 consumption and (E) respiratory quotient (RQ) of PARP-1+/+ and −/− mice (n=9/9) determined by indirect calorimetry. (F) Body temperature after exposure to 4°C (n=6/5). (G) Oral glucose tolerance test (OGTT) (n=5/5) and the area under curve (AUC). (H) PARP-1 autoPARylation (arrow), analyzed in 100μg of protein extract from gastrocnemius muscles of 16 wk-old mice fed ad libitum or fasted (24h). PARP-1 and tubulin levels were checked using 50μg of protein extract. (I) Gastrocnemius from mice on CD or HFD (12 wk) were analyzed as in (H). (J) BW evolution in PARP-1+/+ and −/− mice (n=10/10) fed a CD (circles) or HFD (squares) from 8 wk of age. (K) OGTT and (L) an insulin tolerance test in HFD fed PARP-1+/+ and −/− mice at 16 wk of age (n=10/10). The AUC of the OGTT is shown on the top-right. (M-O) BAT from PARP-1+/+ and −/− mice on CD was extracted and mitochondrial biogenesis was analyzed by (M) transmission electron microscopy, (N) mRNA expression of the genes indicated and (O) the abundance of mitochondrial complexes in 25μg of total protein extracts. (P) SDH staining of sections from gastrocnemius and soleus of PARP-1+/+ and −/− mice on CD. (Q-R) Gastrocnemius was also used to analyze mRNA levels of the indicated genes (Q) and the abundance of mitochondrial complexes in 25μg of total protein extracts (R). White bars represent PARP-1+/+; black bars represent PARP1−/− mice. * indicates statistical difference vs. PARP-1+/+ at p<0.05. For abbreviations, see Table S1.

