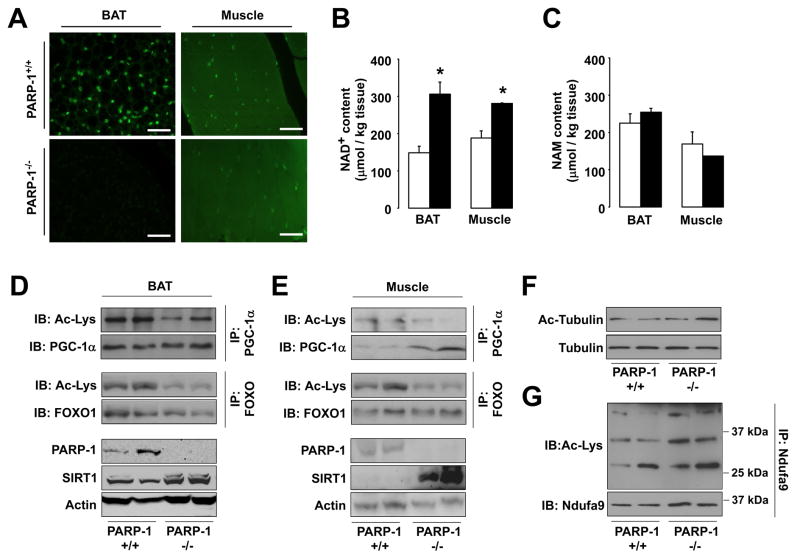
Figure 2. PARP-1 deletion raises NAD+ levels and activates SIRT1.
(A) Protein PARylation determined by α-PAR staining on formalin-fixed 7μm BAT and muscle tissue sections of PARP-1+/+ and −/− mice. White bar = 10μm. (B) NAD+ and (C) NAM levels in BAT and muscle from PARP-1+/+ (white bars) and PARP-1−/− (black bars) mice determined by mass spectrometry. (D-E) PARP-1, SIRT1 and actin protein content in BAT (D) and muscle (E) were determined by Western blot, using 100μg of protein lysate. PGC-1α and FOXO1 acetylation were examined by immunoprecipitation. (F) Tubulin and acetylated-tubulin levels were tested in PARP-1+/+ and −/− gastrocnemius. (G) The Ndufa9 subunit of mitochondrial complex I was immunoprecipitated from 400μg of total protein from gastrocnemius and acetylation levels were analyzed by Western blot. * indicates statistical difference vs. PARP-1+/+ mice at p<0.05.

