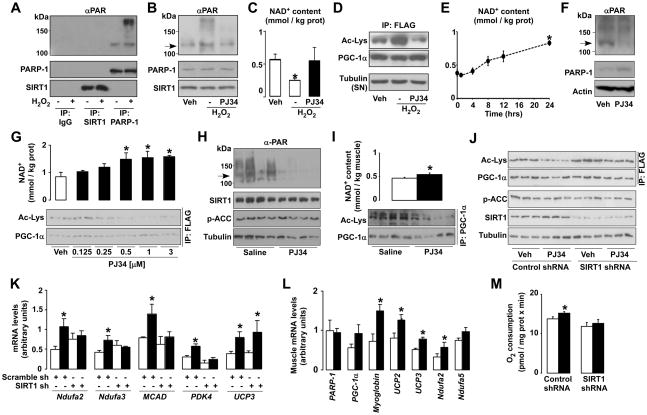
Figure 4. PARP-1 inhibition enhances mitochondrial function through SIRT1.
(A-C) C2C12 myotubes expressing FLAG-HA-PGC-1α were treated for 6h with either PBS (vehicle (Veh)), H2O2 (500μM) or H2O2 and PJ34 (1μM). Then, (A) SIRT1, PARP-1 and unspecific IgG immunoprecipitates from 500 μg of protein extracts were used to test PARylation and the proteins indicated. (B) proteins were analyzed in total cell extracts and the arrow indicates PARP-1 autoPARylation. (C) NAD+ content was measured and (D) PGC-1α acetylation was tested in FLAG immunoprecipitates. Tubulin was checked on the supernatants as input. (E) C2C12 myotubes were treated with PJ34 (1μM) for the times indicated and NAD+ levels were evaluated in acidic extracts. (F-G) C2C12 myotubes expressing FLAG-HA-PGC-1α were treated for 24h with PBS (Veh) or with PJ34 (1 μM, unless stated). (F) PARP-1 protein and autoPARylation (arrow) were determined by Western blot and (G) NAD+ content and PGC-1α acetylation were measured. (H-I) 10-wk old mice received PJ34 (10mg/kg BID i.p.) or saline (Veh) for 5 days before sacrifice (n=10/10); then (H) PARP-1 autoPARylation (arrow), p-ACC and SIRT1 levels were determined in 100μg of total protein extracts from gastrocnemius and (I) NAD+ and PGC-1α acetylation were determined. PGC-1α was immunoprecipitated using 2mg of protein from gastrocnemius muscle and 5μg of antibody. (J-K) C2C12 myotubes expressing FLAG-HA-PGC-1α and either a control or a SIRT1 shRNA were treated with PJ34 for 48h. Then, (J) PGC-1α acetylation levels were quantified in FLAG immunoprecipitates and 50μg of total protein extracts were used to measure the other markers indicated; (K) mRNA levels of selected genes were quantified. (L) Mice were treated as in (H) and mRNA of selected genes was determined in gastrocnemius. (M) C2C12 were treated as in (J) and cellular O2 consumption was measured. White bars represent Veh; black bars represent PJ34 treatment. * indicates statistical difference vs. Veh group at p<0.05. For abbreviations, see Table S1.

