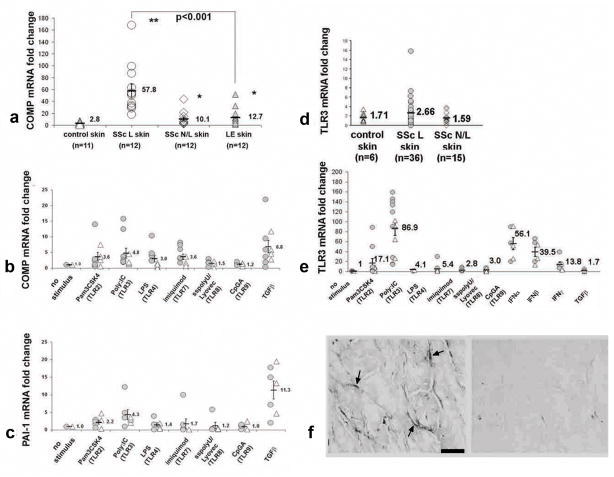
Figure 3. Induction of TGFβ-responsive genes by TLR ligands in SSc and normal dermal fibroblasts.
(a) Increased COMP mRNA expression in dcSSc and LE skin compared to control skin. (b and c) COMP and PAI-1 mRNA expression by dermal fibroblasts from dcSSc (
 ) and control (△) subjects treated with TLR agonists (as in Fig. 1), IFN α/β, IFNγ or TGFβ. (b and c) COMP and PAI-1 expression show significant induction with agonists of TLR2 (p<0.05), TLR3/Poly(I:C) (p<0.05), and TGFβ, (p<0.001). (d) mRNA expression of TLR3 mRNA expression in lesional (SSc L; 1.5-fold increase, p=ns), in non-lesional skin (SSc N/L; 0.92-fold increase, p=ns) from dcSSc patients compared to control skin (n=6). (e) Increased TLR3 mRNA expression by dermal fibroblasts from control (△) and dcSSc (
 ) subjects cultured as in Fig. 2: TLR2 agonist (17.1 fold-increase, p<0.05); TLR3 agonist (86.9 fold-increase, p<0.00001); IFNα (56.1 fold-increase, p<0.00001); IFNβ (39.5 fold-increase, p<0.00001); and IFNγ (13.8 fold-increase, p<0.01). (f) Immunohistochemical staining with anti-TLR3 (left panel) and control Ig (right panel) in dcSSc skin.

