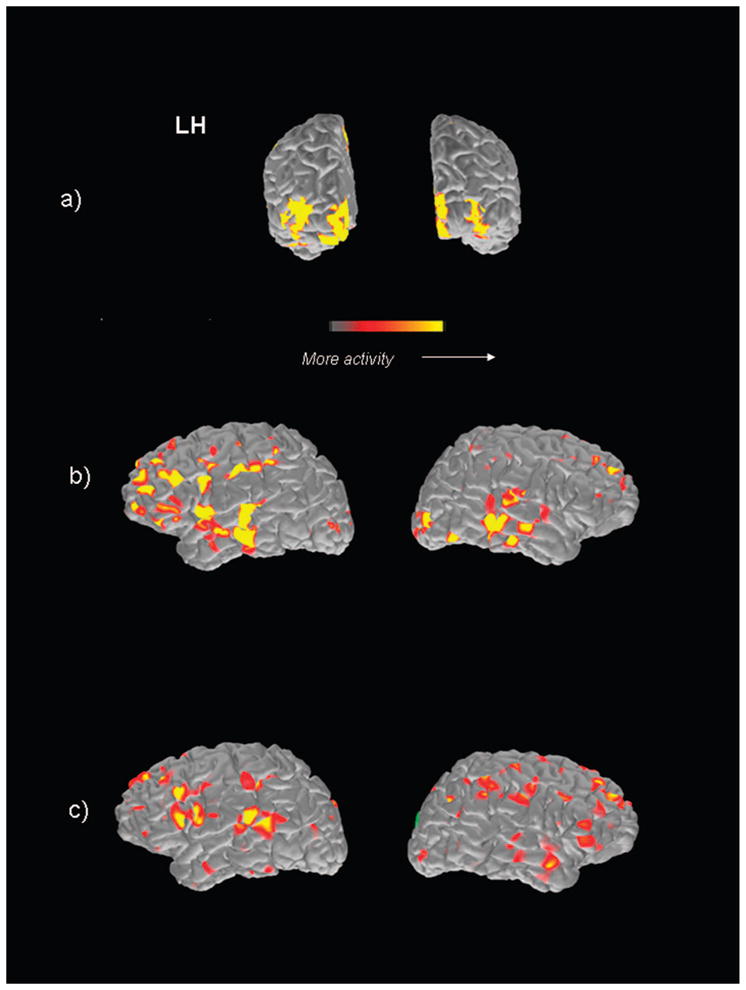
FIGURE 3.

MEG-MRI coregistered data for one participant. Activation has been integrated over a time period of 50 ms within the a, early (centered at 175 ms after stimulus onset); b, middle (centered at 275 ms after stimulus onset); and c, late (centered at 675 ms post stimulus onset) time periods within each hemisphere.
