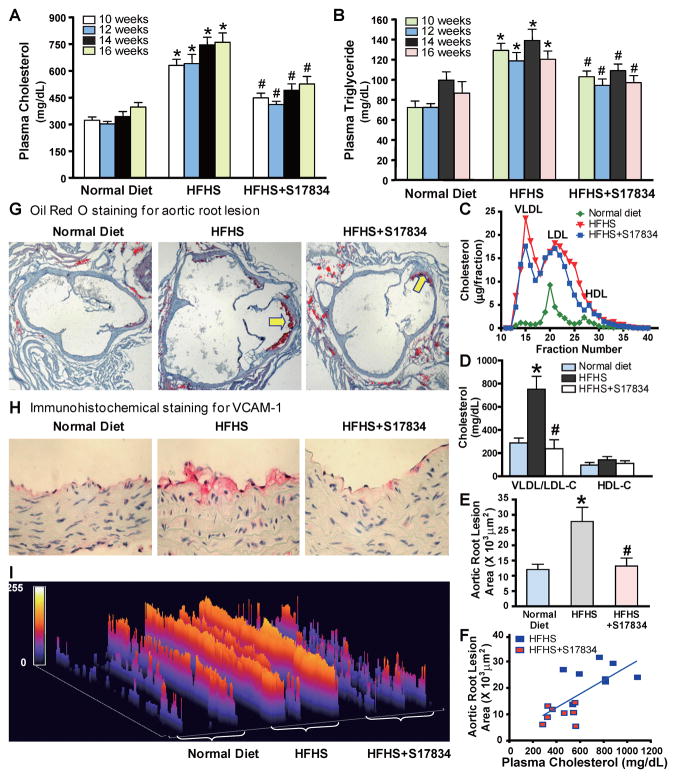
Fig. 3. AMPK activation by S17834 inhibits accelerated aortic atherosclerosis and vascular inflammation in insulin resistant LDLR−/− mice by preventing dyslipidemia.
A. and B. Time-course changes of plasma triglyceride and total cholesterol levels in mice following a 16 h fast are presented as the mean S.E.M, n=8–16. C. Lipoprotein distribution in LDLR−/− mice after 16 weeks of normal diet (green), HFHS diet (red), and HFHS diet supplemented with S17834 (blue). Pooled plasma samples for lipoprotein distribution were determined by FPLC, followed by cholesterol analysis of each fraction. Data are represented as an average (n=3–6) distribution of total cholesterol. D. The increased plasma VLDL/LDL cholesterol in HFHS-fed LDLR−/− mice is attenuated by S17384. Quantification of plasma VLDL/LDL cholesterol (VLDL/LDL-C) and HDL cholesterol (HDL-C) is shown. E. Quantification of atherosclerotic lesion areas in cross-sections of the proximal aorta was performed by computer-assisted image analysis. Total lesion area per section in the entire aortic root was determined and presented as the mean ± S.E.M., n = 8, *P<0.05, vs normal diet mice; #P<0.05, vs HFHS-fed mice. F. Linear regression analysis between plasma total cholesterol levels and aortic atherosclerotic lesions in insulin resistant LDLR−/− mice. Each point represents an individual value of one mouse. G. Representative Oil Red O staining of cross-sections of aortic root in the heart of LDLR−/− mice. H. Expression of vascular cell adhesion molecule-1 (VCAM-1) is reduced in the aorta of S17834-treated insulin resistant mice, as determined by immunohistochemical staining. I. Semi-quantification analysis by ImageJ software of staining intensity of VCAM-1 in atherosclerotic plaques of ascending aortic arch of LDLR−/− mice is shown. The bar graph represents the results from 3 separate mice in each group.

