Figure 2.
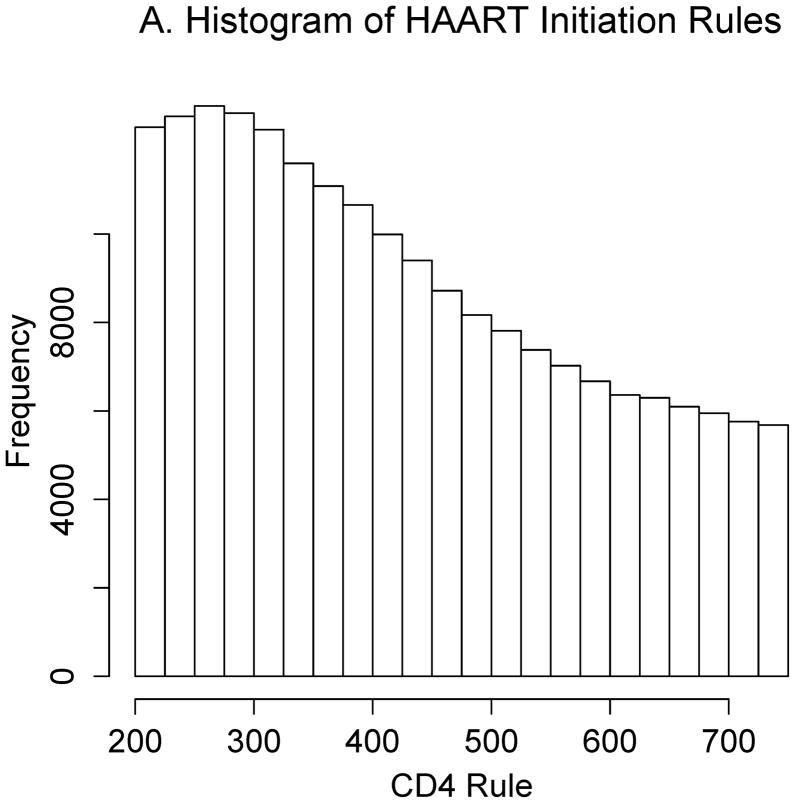
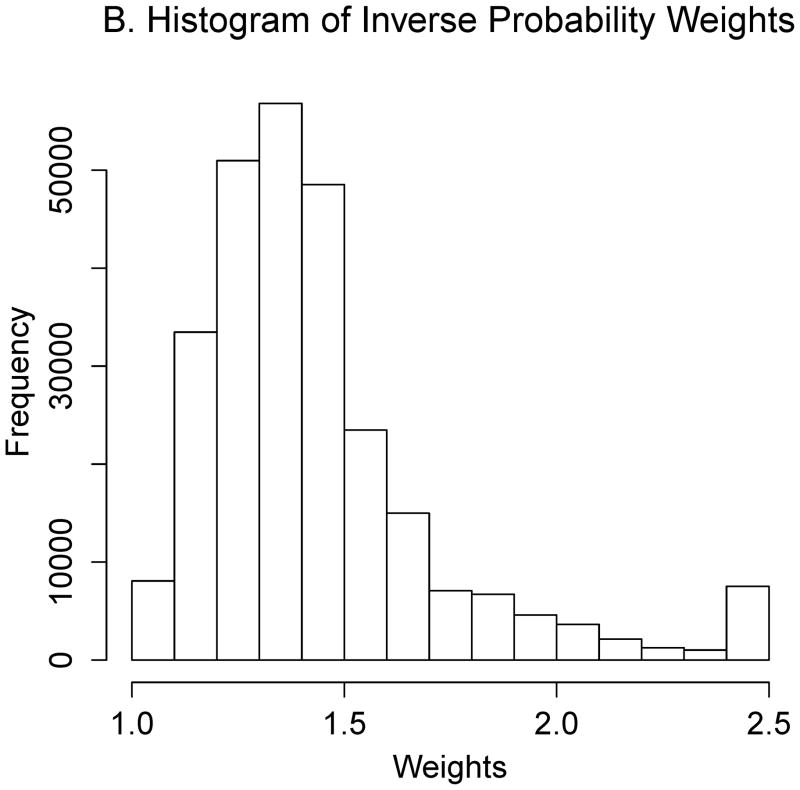
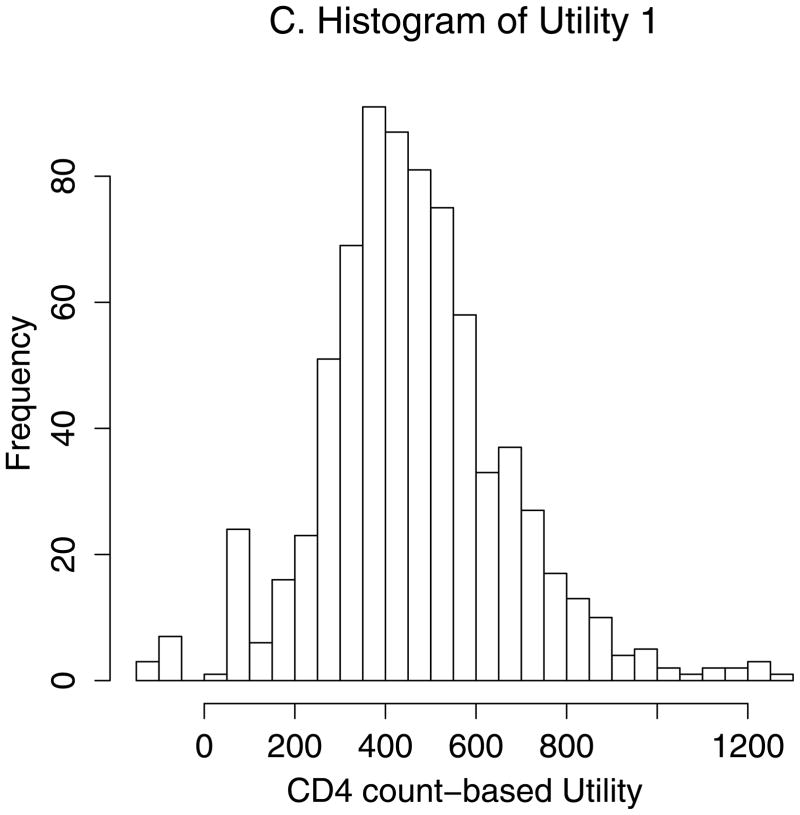
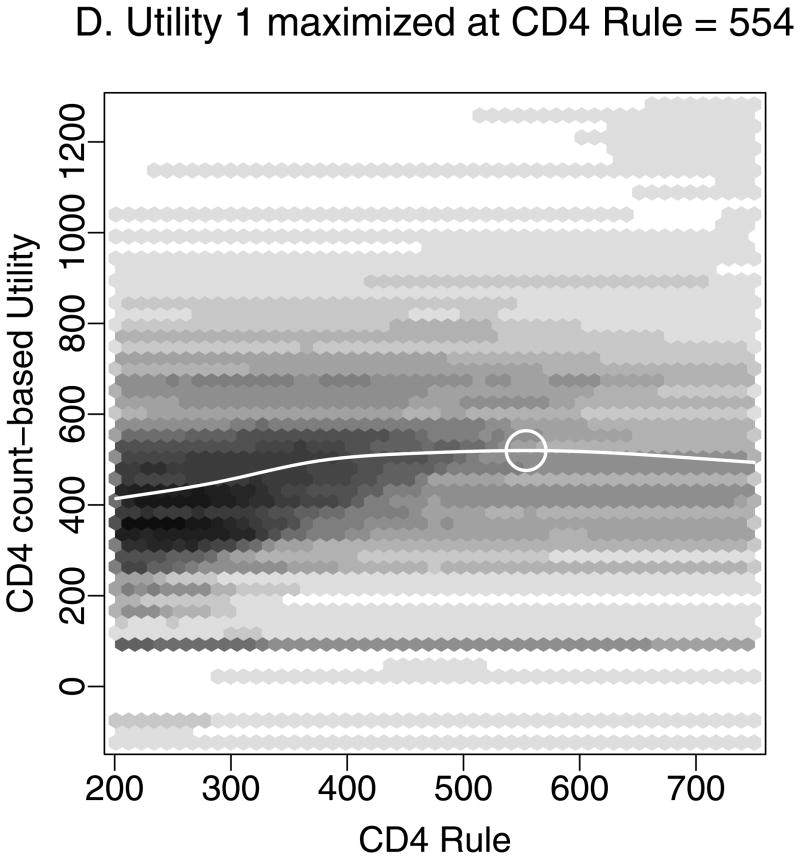
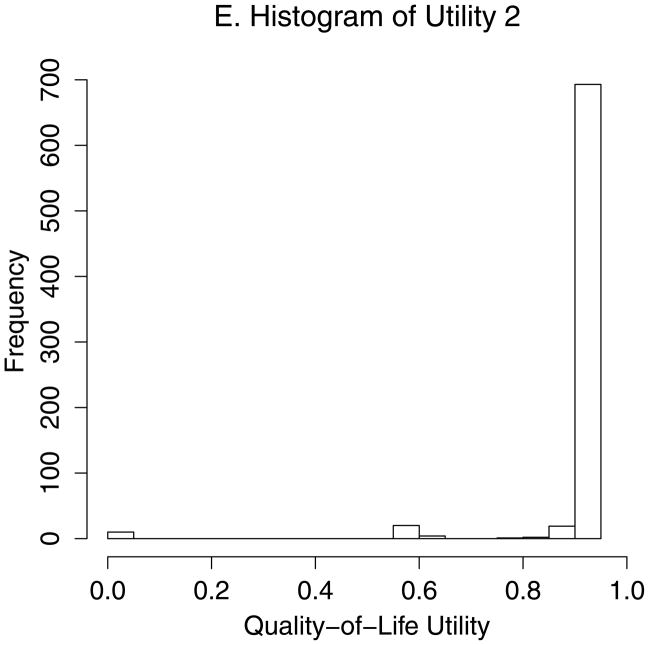
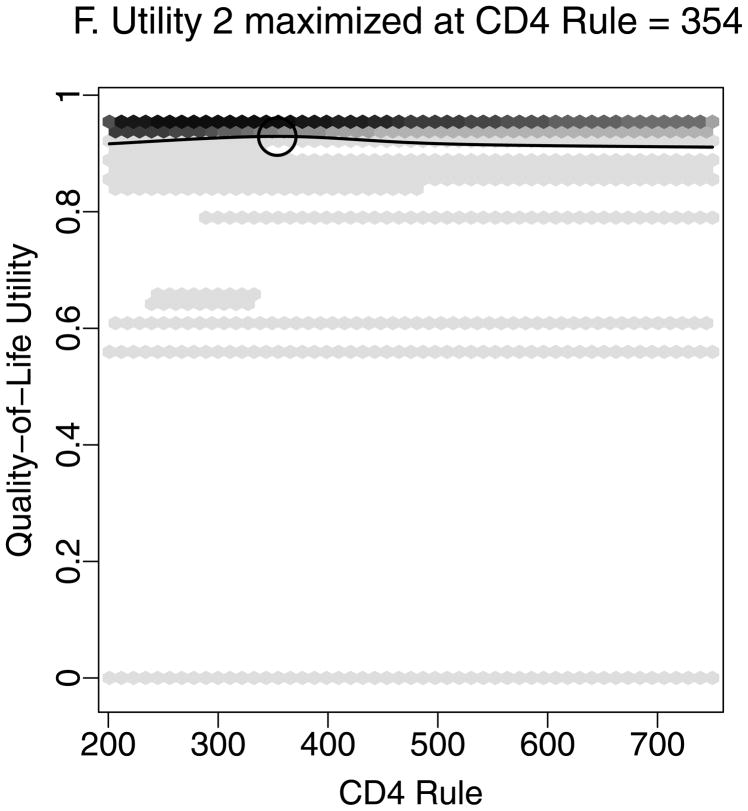
Estimating the optimal CD4 level to initiate HAART in order to maximize health 12 months after study entry. A. The distribution of regimen rules compatible with patients’ CD4/HAART histories. The rules are “start HAART within 3 months of first CD4 measurement below x,” where x is between 201 and 750. B. The distribution of the truncated inverse probability weights used to account for confounding, lost to follow-up, and artificial censoring. C. The distribution of utility 1 (the CD4 count-based measure of patient health) at k = 12 months. D. A plot of the regimen rules of Figure 2A (x-axis) by the CD4 count-based utility of Figure 2C (y-axis), where the shading represents the weight given a particular region of the graph using the inverse probability weights of Figure 2B. The white line is the best-fitting weighted-least-squares regression curve, and it achieves its maximum at the circled location. The rule which corresponds to this maximum, “start HAART within 3 months of first CD4 measurement below 554,” is the estimated optimal rule based on utility 1. E. The distribution of utility 2 (the quality-of-life measure of patient health) at k=12 months. F. A plot of the regimen rules of Figure 2A (x-axis) by the quality-of-life utility of Figure 2E (y-axis), where the shading represents the weight given a particular region of the graph using the inverse probability weights of Figure 2B. The black line is the best fitting weighted least squares regression curve, and it achieves its maximum at the circled location. The rule which corresponds to this maximum, “start HAART within 3 months of first CD4 measurement below 354,” is the estimated optimal rule based on utility 2.

