
Figure 1.
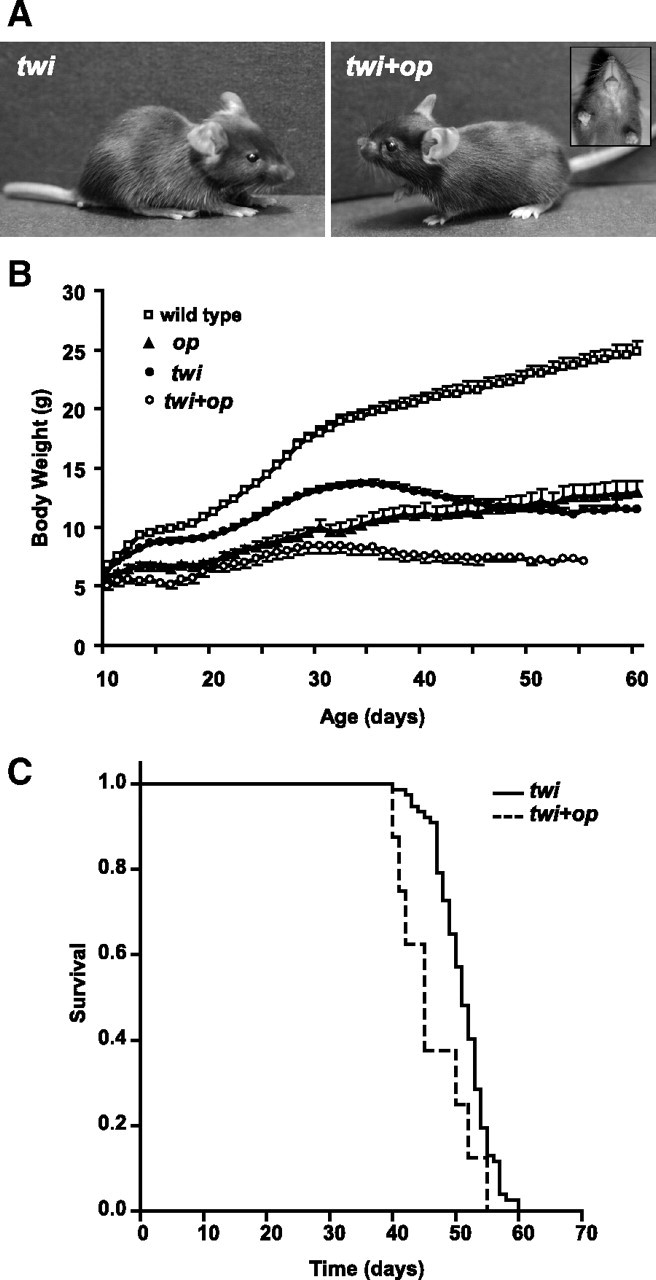
Clinical phenotypes of the twi+op double mutant mouse. A, Physical features of twi (left) and twi+op (right) mice at P23. Note the domed scull and lack of incisors (inset) in the double mutant. B, Growth curves of wild-type (n = 18), op (n = 13), twi (n = 1–55), and twi+op (n = 1–8) mice. The number of animals varies for twi and twi+op mice because of their deaths in this period. If more than three, the data are expressed as mean ± SD. The body weight of twi and twi+op mice peaked at P35 and P29–33, respectively, and then declined along with exacerbated neurological symptoms. C, Survival curves of twi and twi+op mice. Life span of twi+op mice (45 ± 2.1 d, n = 8) was significantly shorter than that of twi mice (51 ± 0.7 d, n = 77, median value ± SD; p = 0.016, Kaplan–Meier log-rank analysis).