
Figure 7.
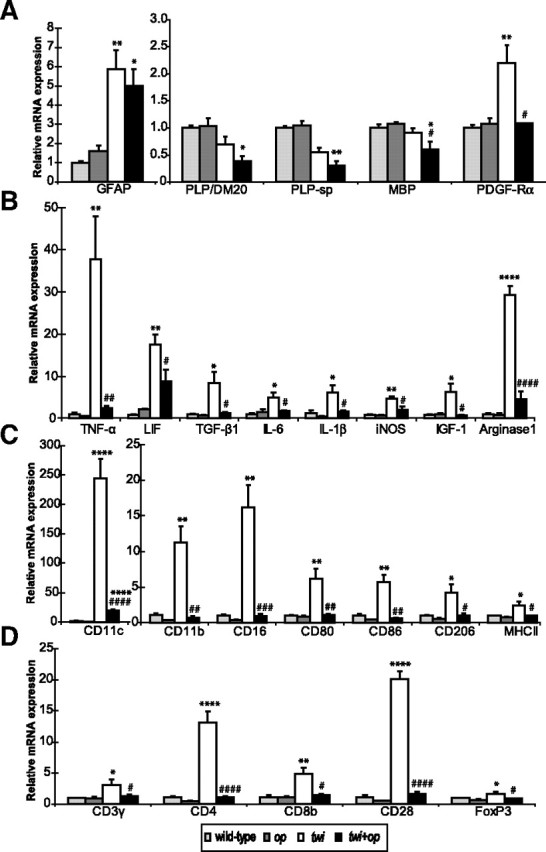
A–D, Quantitative real-time RT-PCR analyses for mRNA expression levels in the cervical spinal cord of 45-d-old mutants. Shown are gene expression levels relative to the levels for the wild-type control (n = 3 each group) for myelin proteins and markers of OPCs and astrocytes (A), molecules related to inflammation (B), surface makers for the cells of monocyte lineage (C), and surface markers for T cells (D). Although op mice tended to express lower levels of mRNA in some molecules (e.g., IL-1β, CD11b, and CD16) compared with wild-type mice, there was no significant difference between the two groups. One-way ANOVA was followed by Scheffé's F test; *p < 0.05, **p < 0.01, ***p < 0.001, and ****p < 0.0001 compared with wild-type mice, and #p < 0.05, ##p < 0.01, ###p < 0.001, and ####p < 0.0001 compared with twi mice. FoxP3, Forkhead box P3; PLP-sp, primers for PLP designed to specifically detect the PLP cDNA sequence that is absent from the DM20 cDNA.