Figure 8.
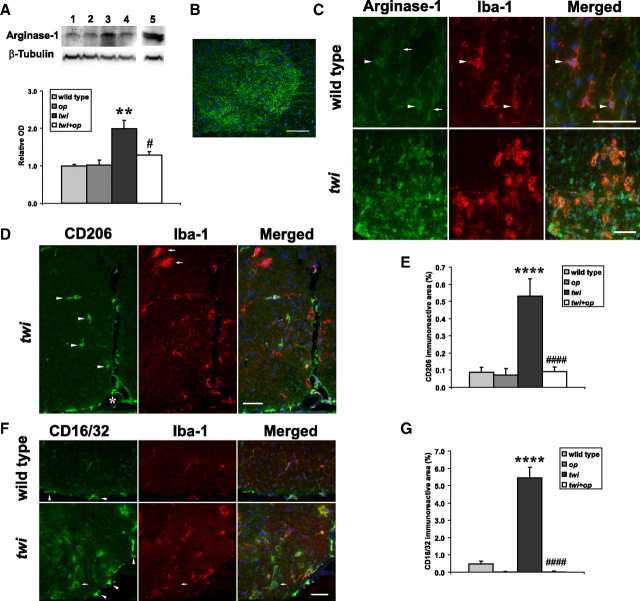
Macrophage markers for M1 and M2 phenotypes are upregulated and distinctively expressed in twi mice. A, Top, A representative Western blot analysis for protein expression of an M2 marker, arginase-1 (41 kDa), and β-tubulin (55 kDa; as an internal control) in the spinal cord of P45 animals. Samples are the spinal cord lysates from the following: wild-type mouse (lane 1); op mouse (lane 2); twi mouse (lane 3); twi+op mouse (lane 4); and a liver lysate from a wild-type mouse as a positive control (lane 5). Bottom, ODS of Western blot were analyzed for argininase-1 protein expression (n = 3 animals per group). B, Representative image of arginase-1 immunoreactivity in the ventral horn of the spinal cord in wild-type mice. Arginase-1 was intensely expressed in the soma and axon of motor neurons. C, Apart from the axons from the ventral horn (arrows), arginase-1 was weakly expressed in Iba-1+ resting microglia in the wild-type control (top, arrowheads). Arginase-1 was more intensely expressed in macrophages in twi mice. Shown is the ventral white matter. Note that Arginase-1 immunoreactivity was also seen in other cell types near the Arginase-1+ macrophages in twi mice. D, Representative double immunofluorescence staining shows that in twi mice, CD206+ cells were mainly localized in the submeningeal spaces (asterisk) and only weakly immunoreactive for Iba-1. Other CD206 cells were found in the perivascular space (arrowheads). Typical Iba-1+ globoid macrophages did not express CD206 (arrows). E, Quantitation of CD206-expressing macrophages in the spinal white matter (excluding submeningeal space). F, Representative double immunofluorescence staining shows that CD16/CD32 was diffusely and weakly expressed in Iba-1+ microglia in wild-type mice (top) and more intensely expressed in macrophages in twi mice (bottom), although occasional CD16/CD32+, Iba-1− cells were observed (arrows). Shown is the ventral white matter. G, Quantitation of CD16/CD32-expressing macrophages (n = 4 each group). One-way ANOVA followed by Scheffé's F test; **p < 0.01 and ****p < 0.0001 compared with wild-type mice, and #p < 0.05 and ####p < 0.0001 compared with twi mice. The merged images include 4′,6-diamidino-2-phenylindole (DAPI) counterstaining in blue. Scale bars, 50 μm.

