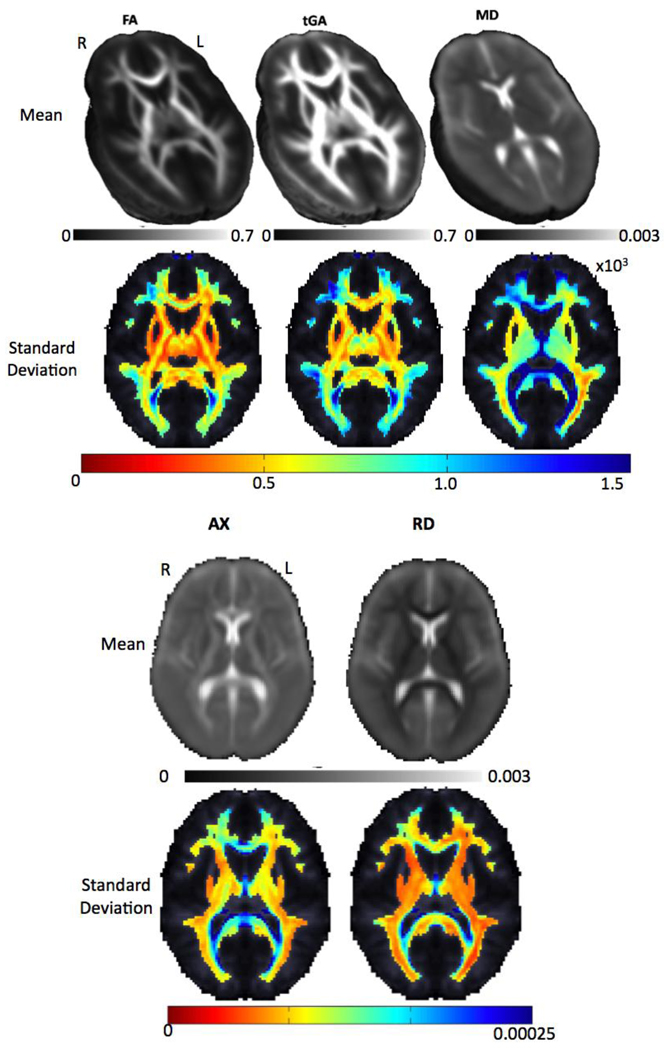
Figure 5.
Average and standard deviation maps for FA, tGA, MD, axial and radial diffusivity from the 207 independent subjects used in this analysis. In the FA and tGA maps, fiber anisotropy is higher, as expected, in the deep white matter tracts (corpus callosum, internal capsule and corona radiata), and the variance in the DTI-derived measures is higher in the same regions (blue colors).

