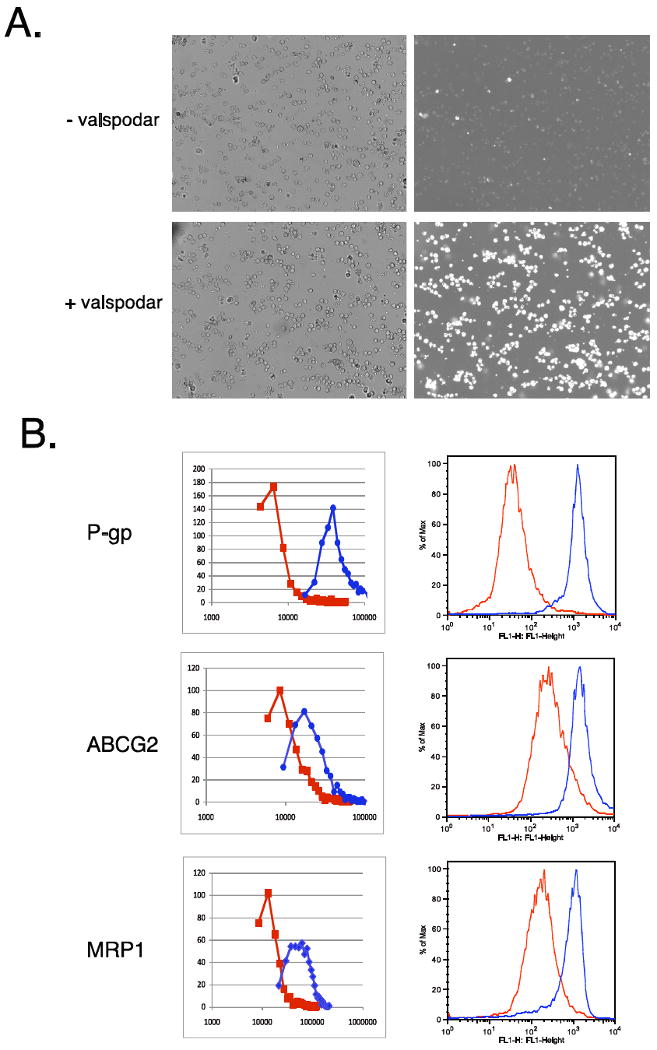
Figure 1.

Intracellular fluorescence of fluorescent substrates measured by the Vision and by flow cytometer. A. Brightfiled images (left row) and fluorescent images (right row) of cells incubated with 2 μg/ml rhodamine 123 in the absence (top row) or presence (bottom row) of the P-gp inhibitor valspodar. B. Transfected cells were incubated with fluorescent substrate in the presence (red line) or absence (blue line) of the appropriate inhibitor and then overlays were generated with the Vision or a flow cytometer. Top row, ABCB1-transfected cells were incubated with 2 μg/ml rhodamine in the presence or absence of 3 μg/ml valspodar; center row, ABCG2-transfected cells were incubated with 500 nM BODIPY-prazosin in the presence or absence of 10 μM FTC; bottom row, ABCC1-transfected cells were incubated with 500 nM calcein AM in the presence or absence of 100 μM MK571.
