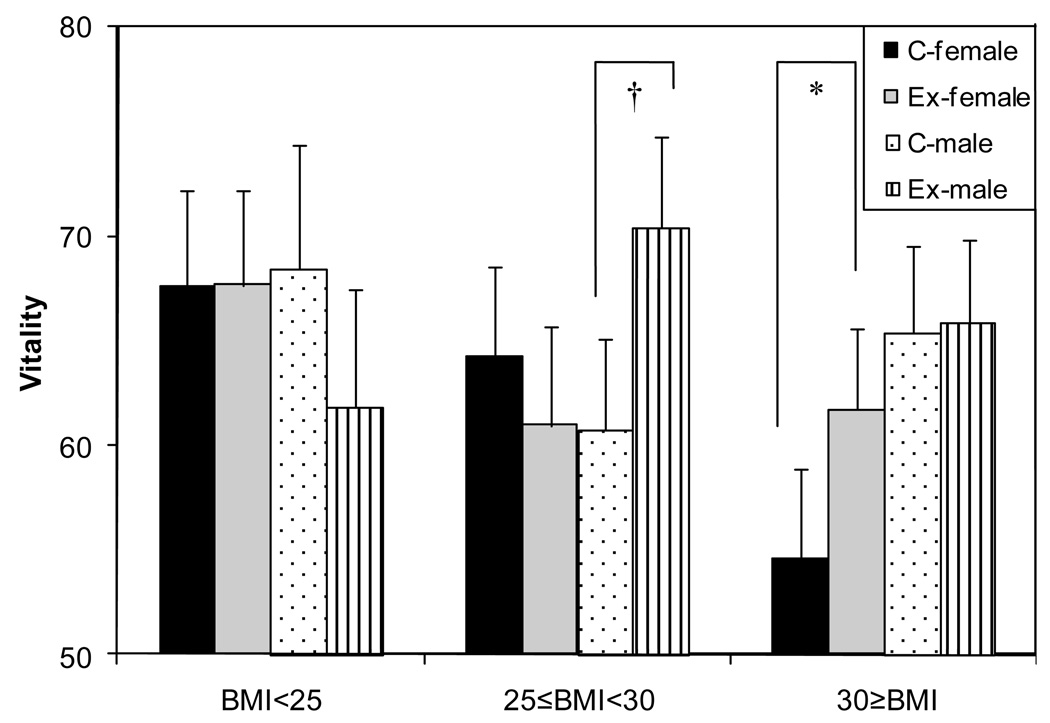
Figure 2.
Depiction of the 3-way interaction between baseline BMI category gender, and intervention effect on vitality, Fred Hutchinson Cancer Research Center, Seattle, WA, 2001–2004
† p<0.01, *p=0.07
p-values for differences between exercisers and controls within subgroups defined by baseline BMI and gender, adjusted for baseline scores and ethnicity
NOTE: the vitality scale is coded with higher scores indicating greater vitality.

