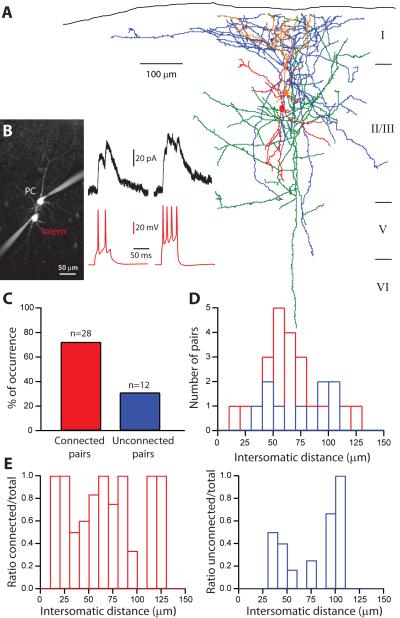
Figure 5. Paired recordings confirm local dense inhibitory innervation.
A, Reconstruction of a connected pair of sGFP interneuron and PC after biocytin labeling. Pia is indicated in black at the top. The dendrites of the interneuron are red and axon in blue and dendrites of PC are orange, with axon in green. Notice the large overlapping area of the interneuron axon and the PC dendrites. B, Image of the connected pair showed in A, the cells are filled with Alexa-594 and electrophysiological recordings of the connection: inhibitory responses recorded in PC (black traces) after two (50 ms, 150 pA) or a burst (50 ms, 300 pA) of APs evoked in the sGFP interneuron (red traces). C, Proportion of connected and unconnected pairs from dual recordings. Within 40 patched pairs, 70% (n=28) were connected and 30% (n=12) were not. D, Intersomatic distances for connected (red, average: 61.90±5.25 μm, n=23) or unconnected (blue, 73.6±9.4 μm, n=9) pairs. There is no significant difference in the intersomatic distances for connected or unconnected sGFP-PC pairs. E, Ratios of connected pairs (red) and unconnected pairs (blue) over the total number of pairs.

