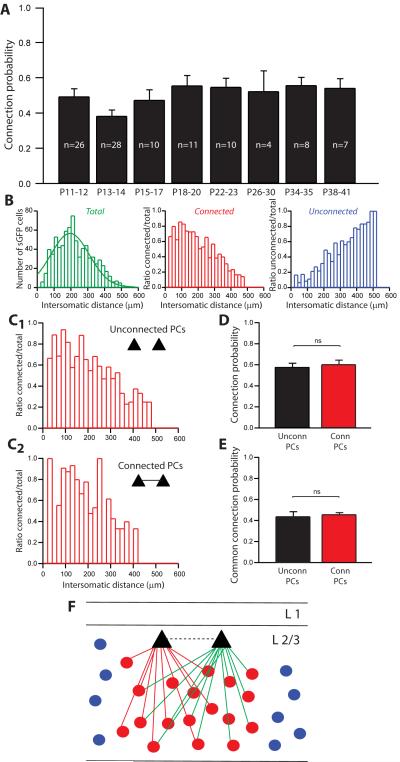
Figure 8. Dense inhibitory innervation across different developmental stages.
A, Connection probability from sGFP cells to PCs at different developmental stages. The inhibitory connection probability is not statistically different throughout the whole range of ages (p<0.05, one-way ANOVA). B, Intersomatic distances for older animals (P20 to P41) for all stimulated sGFP cells; the peak is centered on 194.79±5.74 (n=787). Ratios of connected (red) or unconnected (blue) sGFP cells over the total number of stimulated sGFP cells, as a function of intersomatic distances between sGFP cells and PCs, for older animals (P20–P41). C1 and C2, Ratios of connected interneurons over total number of stimulated interneurons for connected PCs (C1) or unconnected PCs (C2) (P20–P41). There was no significant difference (p=0.24, Wilcoxon paired test) between connected and unconnected PCs for connected interneurons spatial organization. D, Distribution of the probability of inhibitory connections for pairs of PCs (P20–P41), for unconnected PCs (black) or connected PCs (red). There was no significant difference (p=0.83, Mann-Whitney test) of connection probability for unconnected or connected PCs. E, Distribution of the probability of receiving common inhibitory inputs for pairs of PCs (P20–P41), for unconnected PCs (black trace) or connected PCs (red trace). The common connection probability was not significantly different (p=0.67, Mann-Whitney test) for unconnected or connected PCs. F, Hypothetical circuit model that could underlie our results: a dense connectivity of inhibitory inputs from sGFP interneurons where every interneuron is connected to each neighbouring PC. Within a local region, the connectivity could be complete. Dashed line between the two PCs illustrates that the same model applies for connected or unconnected PCs.

