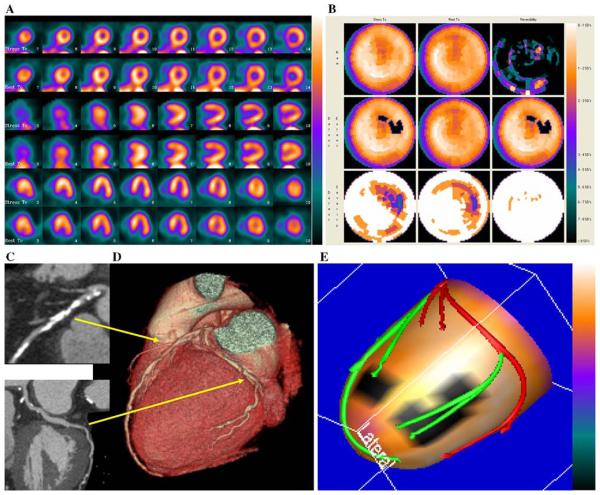
Figure 4.
Example of fusion imaging in a patient with multi-vessel coronary artery disease. A, Short axis, vertical and horizontal long axis slices of the stress/rest SPECT. It was read as probably normal. B, Polar maps of the same SPECT study. C, Multi-planar reconstructions of the coronary arteries on CT angiography showing a plaque in the proximal left anterior descending coronary artery and possible stenosis in the left circumflex coronary artery. D, Three-dimensional rendering of the coronary arteries on CT angiography showing the paths of the coronary arteries and location of plaques seen in the multi-planar reformations in 3B. E, Fused display; the black area on the fused display identifies a region of myocardial hypoperfusion during stress. The segments of the coronary arteries rendered in green are segments distal to stenoses seen on CT angiography. This fused display was read as positive for coronary artery disease. Invasive angiography showed a 50% proximal left anterior descending coronary artery stenosis and a 90% stenosis in the first marginal vessel; thus the fused display was interpreted correctly.

