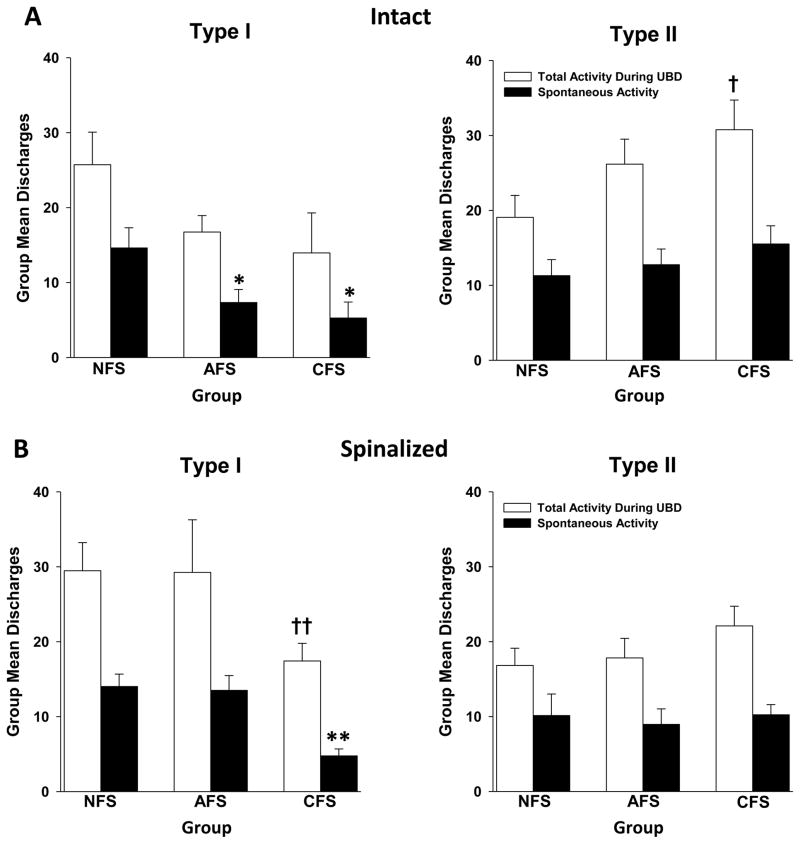
Figure 3.
Histograms depict group mean (± SEM) total (open bars) and spontaneous (closed bars) activity of Type I and Type II L6-S1 spinal DHNs in Hz. Spontaneous activity was determined as the average rate of neuronal discharges per second in the 10 sec period prior to the onset of UBD. Total activity was determined as the rate of neuronal discharges in the 20 sec period during the UBD stimulus. The data represent the mean of the average response of each cell in a particular group. (A) In the intact preparations, spontaneous activity of Type I neurons was significantly decreased compared to NFS after either AFS or CFS exposure (left), while spontaneous activity of Type II neurons was unaffected by stress (right). A significant change in total activity was only observed in Type II neurons and only after CFS (right). (B) In spinalized preparations, Type I neurons demonstrated an inhibition of spontaneous activity and total activity after CFS (left). Spontaneous and total activity of Type II neurons was unchanged by stress (right). * and † indicate significantly different compared to the NFS condition with p<0.05. ** and †† indicate significantly different compared to the NFS condition with p<0.01. N=8–32/group.

