
Fig. 3.
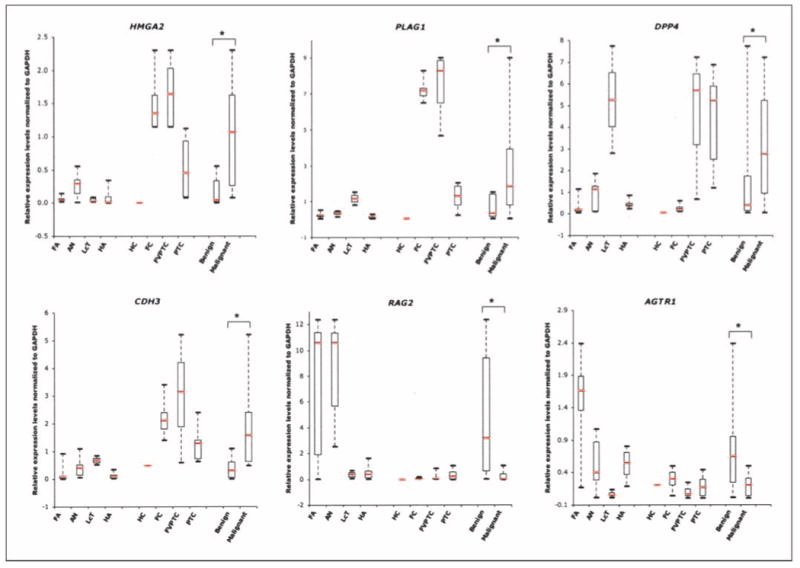
Real-time RT-PCR validation of six genes (HMGA2, PLAG1, DPP4, CDH3, RAG2, and AGTR1) using 31 new thyroid tumors. Relative expression levels normalized to GAPDH in 20 benign [follicular adenomas (n = 7), adenomatoid nodules (n = 7), lymphocytic thyroiditis nodules (n = 2), and Hürthle cell adenomas (n = 4)] and11 malignant [Hürthle cell carcinoma (n = 1), follicular carcinoma (n = 3), follicular variant of papillary thyroid carcinomas (n = 3), and 10 papillary thyroid carcinomas (n = 4)] tumors were determined using gene-specific primers. The upper and lower limits of each box represent “third” and “first” quartiles, respectively. Red lines, medians; whiskers, extreme measurements; *, P < 0.001 by two-tailed t test between benign and malignant tumor-types. Note: as expected from the microarray analysis, HMGA2, PLAG1, and CDH3 are overexpressed, whereas both RAG2 and AGTR1 are underexpressed in malignant tumors compared with benign.