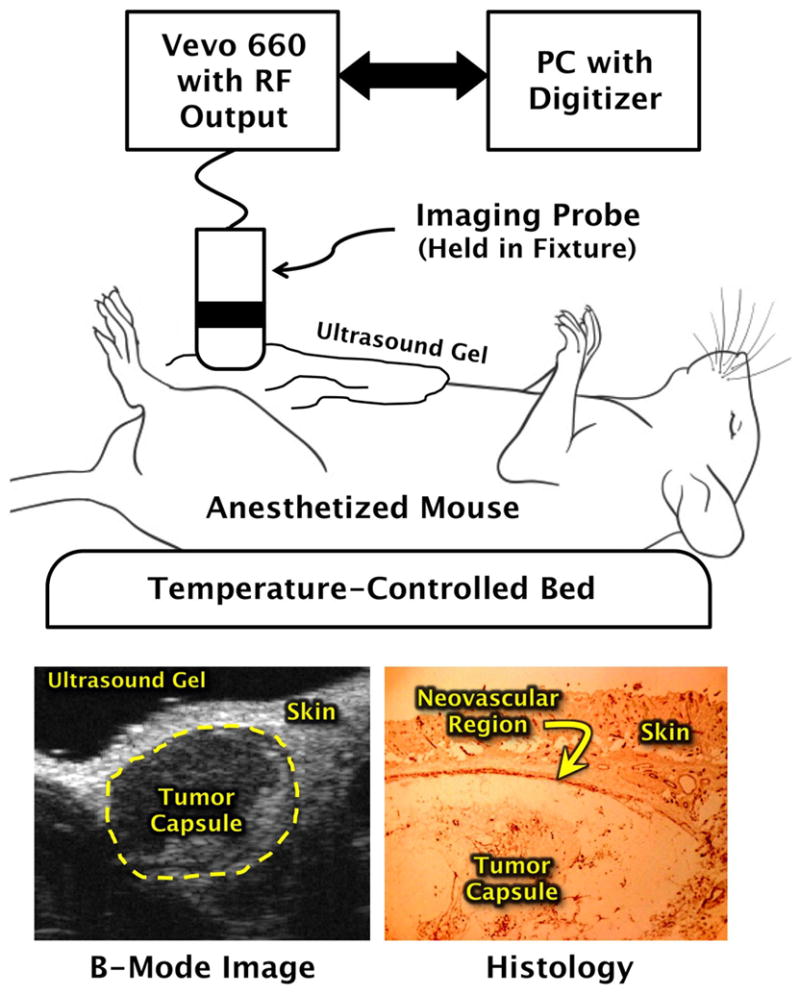
Fig. 1.

Schematic diagram of the equipment used to acquire in vivo backscattered RF data. Bottom panels show example B-mode ultrasound image of tumor (left), and a stained histologic section of a tumor indicating portions where αvβ3-targeted nanoparticles nanoparticles could adhere.
