
Figure 2. The pore and C-terminal tail of InsP3 receptors.
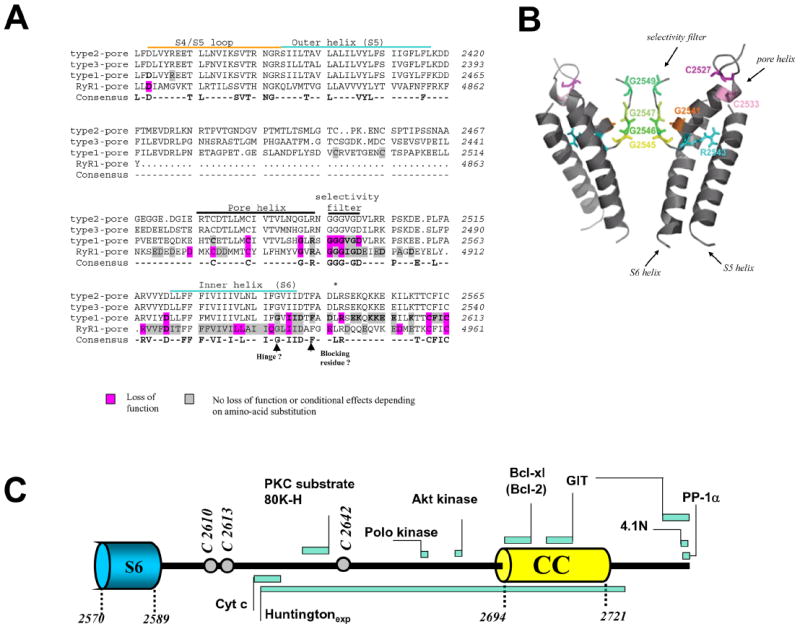
Panel A shows the sequence of a portion of the pore region of InsP3Rs. The consensus residues shown in bold are identical in all 3 InsP3R isoforms and all 3 RyR isoforms although only the sequence of RyR1 is shown in the Figure. Residues which have been mutated in InsP3R1 are shown together with their functional consequences. The analogous mutations in RyRs are shown. For additional information see text and Ref. (9). The R2596 position is indicated by an asterisk. Panel B A homology model of the InsP3R based on a KirBac 1.1 template is shown. The image is taken from Ref. (9) and is used with permission. Only the location of selected mutations from Panel A are shown. The linkers between S5 and the pore helix, and between the selectivity filter and S6, were not included in the model. Panel C shows a cartoon of the C-terminal tail with endogenous cysteines indicated by open circles and bars to indicate the approximate location of interacting proteins. CC = coiled coil domain. GIT; G-protein coupled receptor kinase-interacting protein, PP1-a; protein phosphates 1-a, 4.1N; neuron specific isoform of erythrocyte protein band 4.1. For additional details see text.