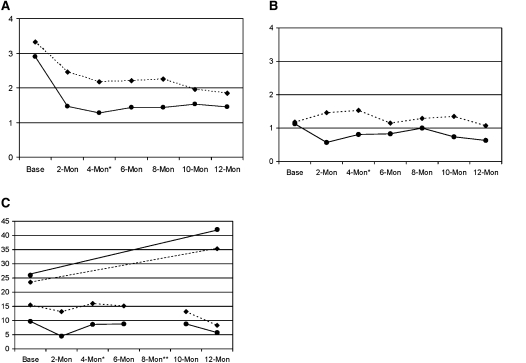
Figure 2.
Descriptive data for significant health outcomes by assessment time point and treatment group. (A) Number of nights wakened in previous 2 weeks. (B) Number of days activity limitation in previous 2 weeks. (C) Number of school absences displayed as annualized rates at each time point. Top two lines show Department of Education de-identified data of all students for the baseline and follow-up years. Bottom two lines show bimonthly self-report data for absences due to asthma over the last 2 weeks, converted to annualized rates (mean 2-wk values at each time point × 18, the number of 2-week periods in a school year. Diamonds, dotted lines: control; circles, solid lines: intervention. *Corresponds roughly to immediate postintervention; **August, no school.

