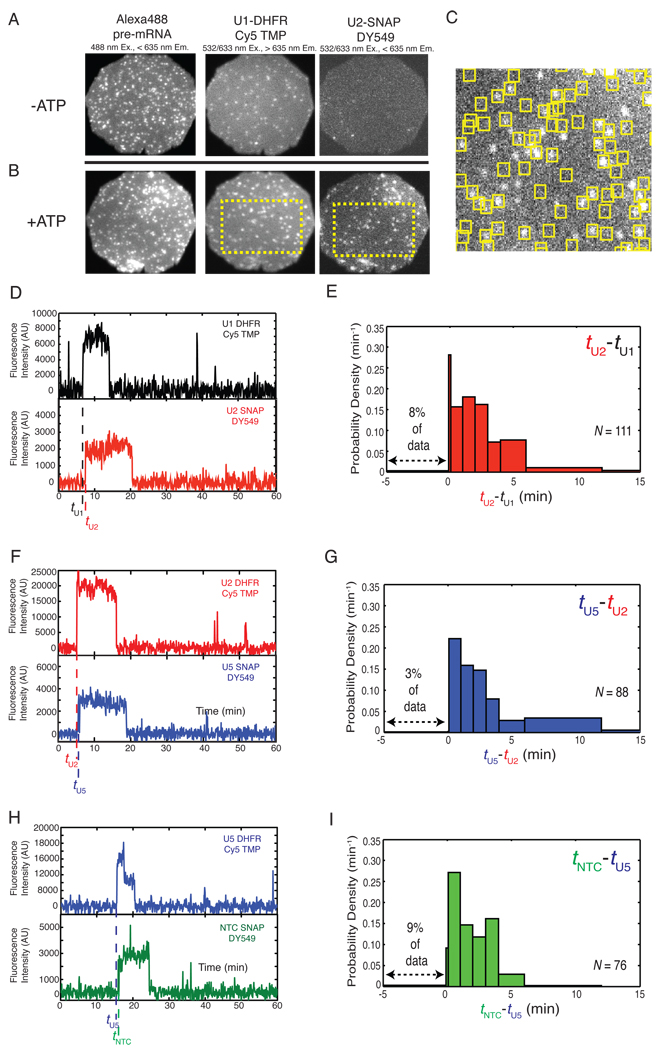
Figure 4.
(A and B) Images of two FOVs taken at three different wavelengths with triple label extract to monitor U1-DHFR/Cy5-TMP and U2-SNAP-DY549 association with Alexa488-labeled pre-mRNA, without (A) or with (B) ATP. (C) Magnification of dashed area in (B) showing co-localization of U1 (yellow boxes) with U2 (white spots). (D) Fluorescence intensity traces showing association of U1 and U2 with an individual pre-mRNA molecule (not shown) in the presence of ATP. Arrival times for each subcomplex (tU1 and tU2) are marked. (E) Histogram of the delay between subcomplex arrival times (tU2-tU1). (F, H) Single molecule fluorescence intensity traces for U2/U5 (F) and U5/NTC (H) bound to single pre-mRNA molecules (not shown). (G, I) Histograms of the delays between U2 and U5 binding (G) and U5 and NTC binding (I).

