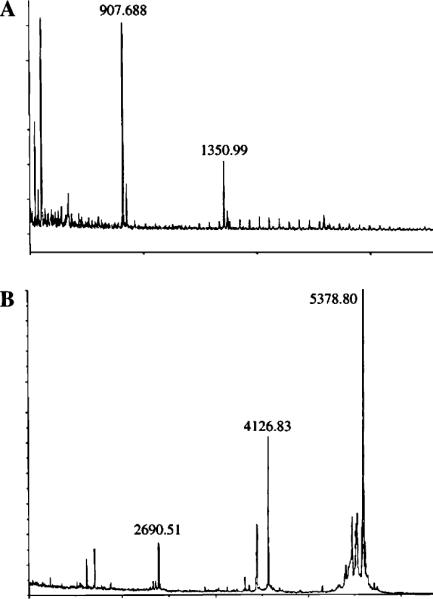
Fig. 5.

Mass spectrometry of two muropeptide bands. A. Monomer–tetrapeptide (M4)–ANTS. The band shown in Fig. 4, lane 3, was eluted and subjected to mass spectrometry. The M4–ANTS signal is at 1350.99. A contaminating peak at 907.688 originated after passage of the material through the Millipore ZipTip matrix used for sample preparation (data not shown). (B) Dimer–tetrapeptide–tetrapeptide (D44)–ANTS. The band shown in Fig. 4, lane 5, was eluted and repurified by HPLC to be certain that only a single component was analyzed by mass spectrometry. The peak at 2690.51 represents the dimer, that at 5378.80 represents a condensation of two dimers, and the peak at 4126.88 is an unidentified breakdown product.
