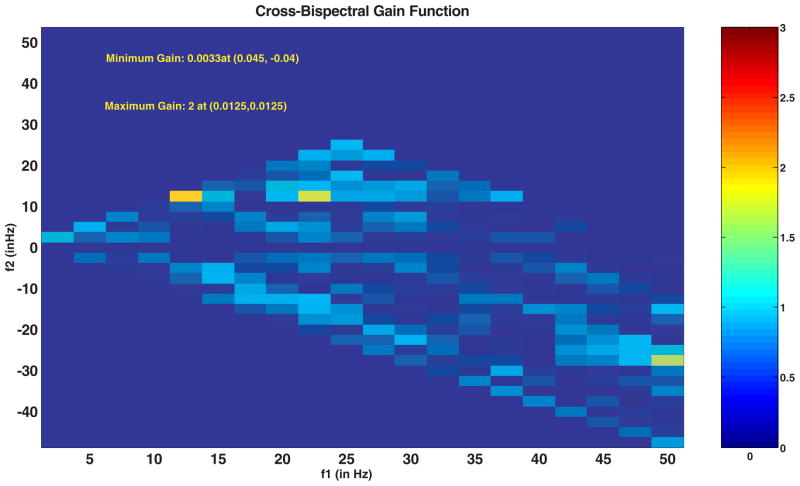
Fig. 4.
Shows a typical cross-bicoherence gain function or 2D BISCOH function of ictal signals recorded for AN and CTX. The color bar shows the level of nonlinearities with signals greater than one have a deliberate gain in nonlinearities from input to output. Noise or other uncorrelated signals contribute to gains less than one (blue zone).

