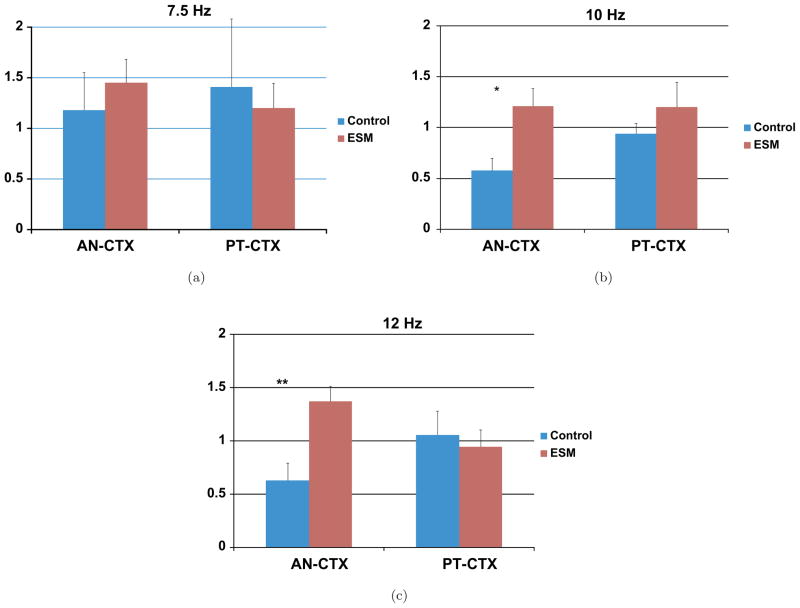
Fig. 7.
Shows plots of averaged AN-CTX and PT-CTX 1D-BISCOH for 4 control and 4 ESM-treated animals for different frequencies showing increases in nonlinearities at the frequencies, 7.5, 10 and 12.5 Hz. Data was taken first 8 seconds of initial ictal episode. The solid color bars represent saline controls whereas vertical and horizontal plots represent ESM-treated AN-CTX and PT-CTX BISCOH sums, respectively. There is a significant change in AN-CTX 2D-BISCOH when treated with anti-epileptic drug. A growth in non-linearity accompanies the addition of the drug. Significant growth in nonlinearities occurs with the addition of this AED. The growth in nonlinearities is evident particularly around the alpha band frequency band. At 10 and 12.5 Hz there is a great rise in BISCOH.

