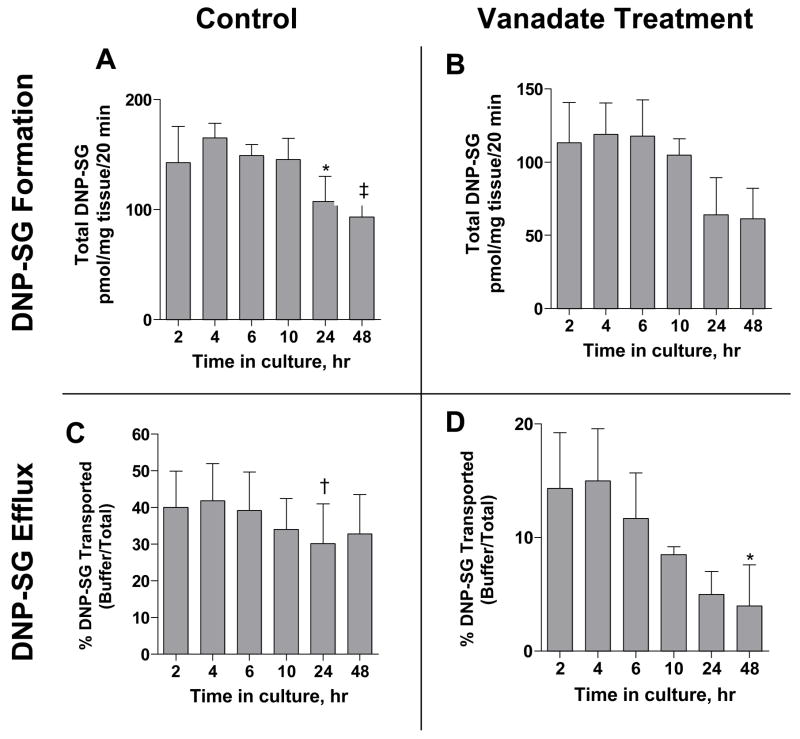
Figure 5. Effect of time in culture on DNP-SG formation and DNP-SG efflux.
Figure 5. Effect of time in culture on DNP-SG formation (A & B) and DNP-SG efflux (C & D) measured at 20 min, in the absence (A & C) or presence (B & D) of ATPase inhibitor sodium orthovanadate, following brief exposure to 100 μM CDNB. Media was replaced at 24 h. Data represent mean ± SEM from triplicate determinations in placental tissue samples from n=3 patients (patients 1, 3, 4). * represents p<0.05 vs. 4 h time point, † represents p<0.05 vs. 2, 4 h time points each and ‡ represents p<0.05 vs. 2, 4, 6, 10 h time points each for the individual panel graphs, when compared by repeated measures one-way ANOVA followed by Tukey’s post test for all pair wise comparisons, all other comparisons were not significant.

