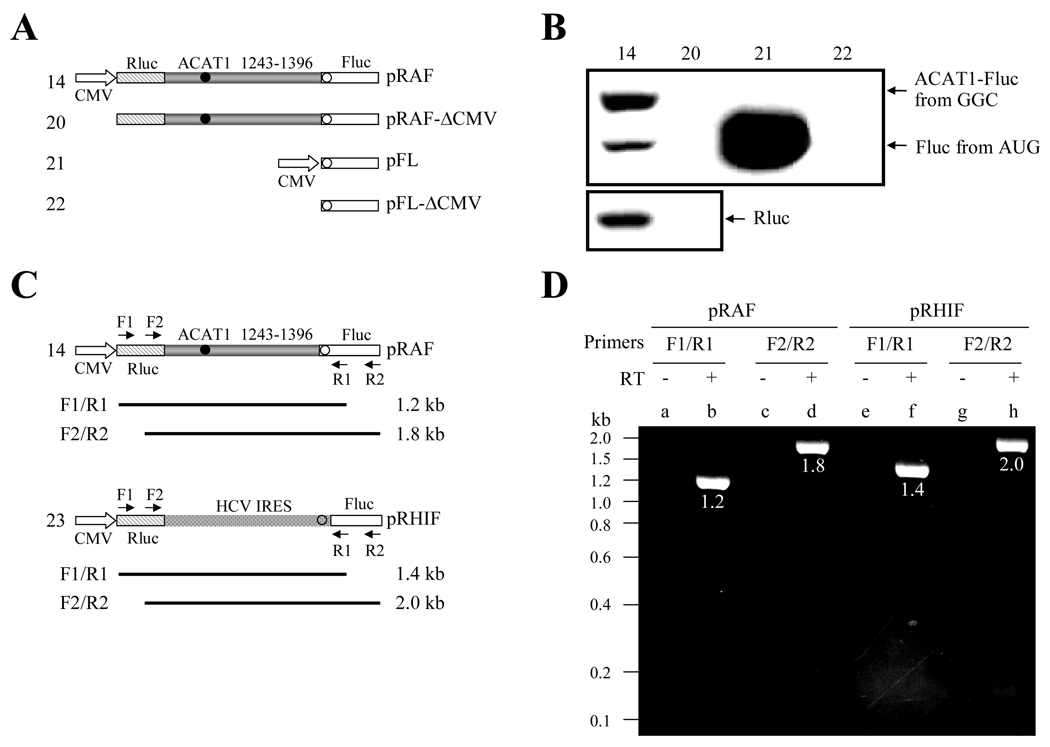
Figure 3. The vicinity of the GGC1274–1276 codon in the bicistronic plasmid does not show the cryptic promoter activity or contain the aberrant splicing site.
(A) Schematic representation of the bicistrons and monocistron with or without the eukaryotic CMV promoter. The plasmids pRAF and pRAF-ΔCMV contain the first cistron of the whole AUG-ORF of Renilla luciferase and the second one by fusing the vicinity of GGC1274–1276 codon (nt 1243–1396) with the 5'-end of whole AUG-ORF of Firefly luciferase. The plasmids pFL and pFL-ΔCMV only contain a cistron of the whole AUG-ORF of Firefly luciferase. The eukaryotic CMV promoter is respectively deleted from the 5'-ends of the whole AUG-ORF of Renilla luciferase and Firefly luciferase in the plasmids pRAF-ΔCMV and pFL-ΔCMV. Gray bar, the vicinity of GGC1274–1276 codon (ACAT1 1243–1396); hatched bar, whole AUG-ORF of Renilla luciferase (Rluc); white bar, whole AUG-ORF of Firefly luciferase (Fluc); filled circle, GGC1274–1276 initiation codon; hollow circle, AUG1397–1399 initiation codon.
(B) The expression plasmids depicted in (A) are transiently transfected into AC29, the lysates are prepared and immunoblotting is carried out with anti-Fluc antibody and anti-Rluc antibody respectively. The immunoblotting result with anti-Fluc antibody is shown on the top panel and arrows indicate the positions of the fused ACAT1-Fluc protein initiated from the GGC1274–1276 and Fluc protein initiated from AUG1397–1399. The immunoblotting result with anti-Rluc antibody is shown on the bottom panel and an arrow indicates the position of Rluc protein. The experiments are repeated three times with similar results.
(C) Schematic representation of the location of four PCR primers at the bicistronic plasmids pRAF and pRHIF. The primer F1 and R1 are respectively located at the 5'-ends of the whole AUG-ORF of Renilla luciferase and Firefly luciferase, and the primer F2 and R2 are respectively located at the 3'-ends of the whole AUG-ORF of Renilla luciferase and Firefly luciferase. The calculated sizes of PCR products by using primer sets F1/R1 and F2/R2 are shown. Spots bar, the region of HCV IRES; hollow circle, AUG initiation codon; others representing the same in (A).
(D) RT-PCR analysis of total RNAs from the cells transfected with the plasmids pRAF and pRHIF is performed by using two sets of primers F1/R1 and F2/R2. Lanes b (1.2 kb), d (1.8 kb), f (1.4 kb) and h (2.0 kb) show the amplified products with the size depicted on left from the pRAF- or pRHIF-transfected cells when F1/R1 and F2/R2 primer sets are used. Lanes a, c, e and g show reverse transcription-negative controls for each sample. The experiments are repeated three times with similar results.

