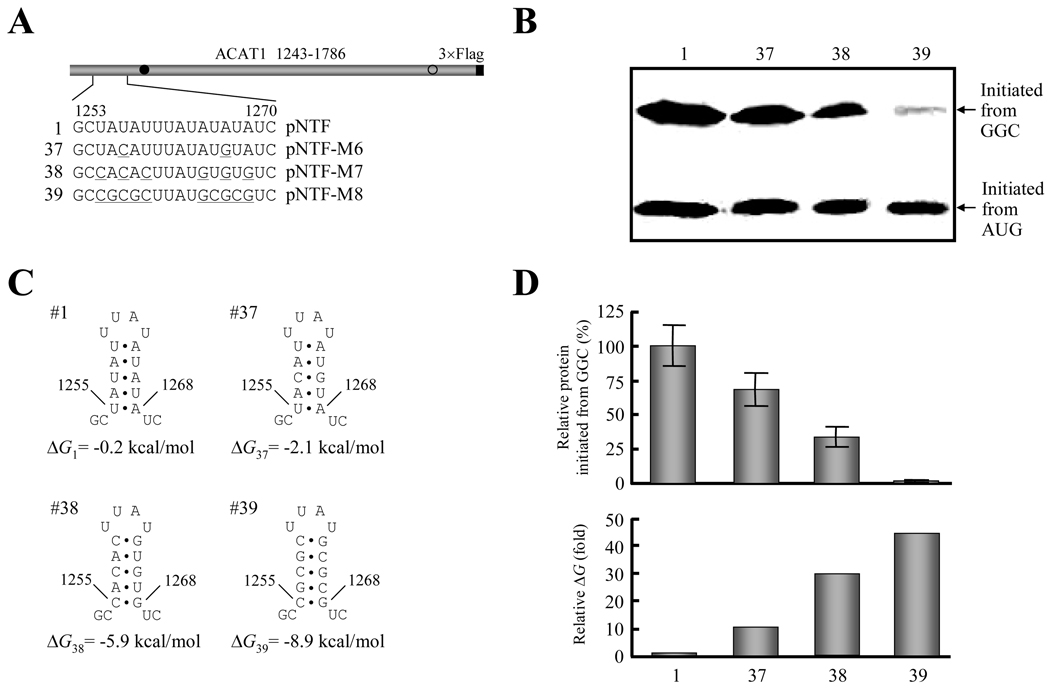
Figure 6. Stability of the upstream RNA secondary structure is inversely correlated with production of protein initiated from the GGC1274–1276 codon.
(A) Schematic representation of the partial ACAT1 mRNA sequence (nt 1243–1786) and the replacement of AU nucleotides by GC nucleotides in stem-loop I. The detailed sequence of nt 1253–1270 is listed and the replaced nucleotides are underlined. Gray bar, partial ACAT1 mRNA sequence (ACAT1 1243–1786); black bar, 3×Flag coding sequence (3×Flag); filled circle, GGC1274–1276 initiation codon; hollow circle, AUG1397–1399 initiation codon.
(B) The expression plasmids depicted in (A) are transiently transfected into AC29, the lysates are prepared and immunoblotting is carried out with anti-ACAT1 antibodies (DM10). Arrows indicate the positions of ACAT1-NT-Flag proteins respectively initiated from GGC1274–1276 and AUG1397–1399. The experiments are repeated three times with similar results.
(C) Predicted RNA secondary structures of nt 1253–1270 without or with mutations of stem-loop I depicted in (A). The folding Gibbs free energy (ΔG) of predicted RNA secondary structure is listed beneath each one.
(D) Relative production of ACAT1-NT-Flag protein initiated from the GGC1274–1276 codon (up panel) and folding ΔG of RNA secondary structures (down panel). The intensity of products from the GGC1274–1276 codon in (B) is quantified by using the UVP Labwork software (UVP Inc.) for densitometric analysis and normalized to the value of wild type one. The data mean ± SD from three independent experiments. The relative folding ΔG of RNA secondary structures in (C) is shown by using the wild type one as 1.0.

