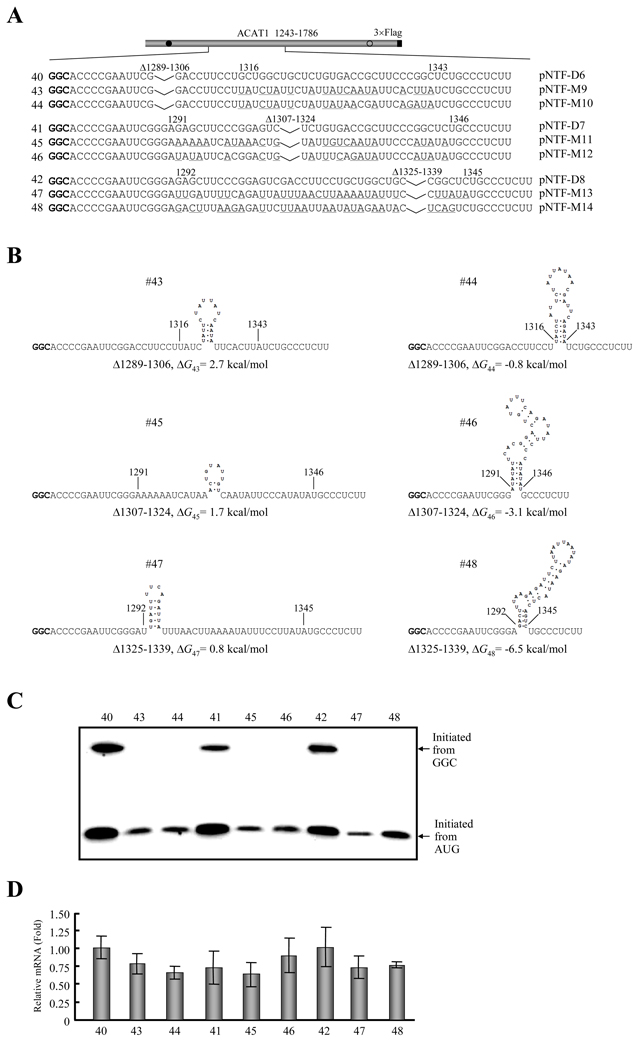
Figure 8. GC-richness of the downstream RNA secondary structures is essential for production of proteins initiated from the GGC1274–1276 codon.
(A) Schematic representation of the partial ACAT1 mRNA sequence (nt 1243–1786) and mutations introduced into the formed RNA secondary structures after sub-deletions of stem-loop II. Each sequence after sub-deletion of stem-loop II is listed without or with the mutated nucleotides (underlined) and the deleted regions (Δ1289–1339, Δ1289–1306, Δ1307–1324 and Δ1325–1339) are marked on top. Gray bar, partial ACAT1 mRNA sequence (ACAT1 1243–1786); black bar, 3×Flag coding sequence (3×Flag); filled circle, GGC1274–1276 initiation codon; hollow circle, AUG1397–1399 initiation codon.
(B) Predicted RNA secondary structures with introduced mutations depicted in (A). The folding Gibbs free energy (ΔG) of predicted RNA secondary structure is listed beneath each one.
(C) The expression plasmids depicted in (A) are transiently transfected into AC29, the lysates are prepared and immunoblotting is carried out with anti-ACAT1 antibodies (DM10). Arrows indicate the positions of ACAT1-NT-Flag proteins respectively initiated from GGC1274–1276 and AUG1397–1399. The experiments are repeated three times with similar results.
(D) RT-qPCR analysis of total RNA from the cells transfected with the plasmids depicted in (A) is performed according to procedures described in the Materials and Methods. The ACAT1 mRNA levels are normalized to the GAPDH mRNA levels for each sample and the relative mRNA of the cells transfected with pNTF-D6 is designated as the control one (1.0). The data mean ± SD from three independent experiments.

