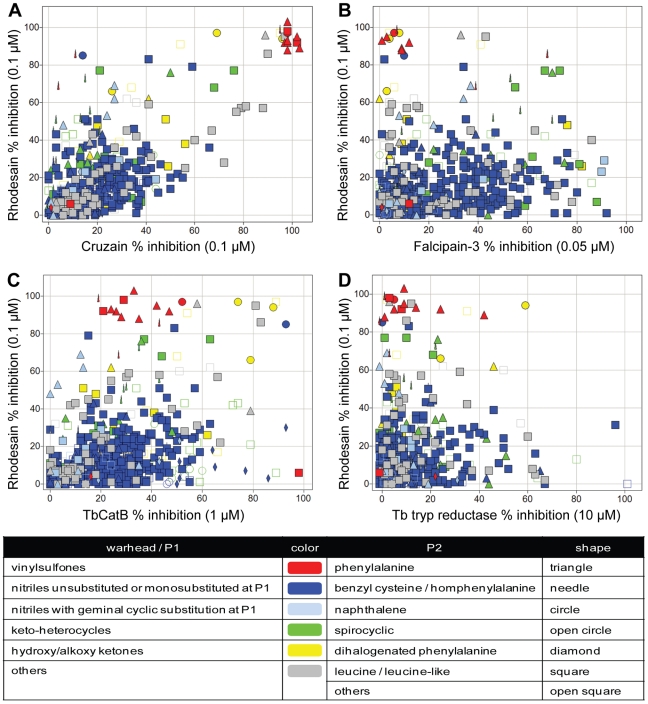
Figure 2. Comparing percent inhibition of compounds between cysteine proteases.
Single-point inhibition data for rhodesain (Y-axis, % inhibition at 0.1 µM test compound) as compared to other parasite enzymes (X-axes), including: (A) cruzain (% inhibition at 0.1 µM), (B) falcipain-3 (% inhibition at 0.05 µM), (C) TbCatB (% inhibition at 1 µM), and (D) trypanathione reductase (% inhibition at 10 µM). Individual data points are colored according to warhead/P1 type as follows: vinylsulfones (red), nitriles unsubstituted or monosubstituted at P1 (blue), nitriles with geminal cyclic substitution at P1 (light blue), keto-heterocycles (green), hydroxy/alkoxy ketones (yellow) and others (grey). The shape of each data point corresponds to the P2 chemotype as follows: phenylalanine (triangle), benzyl cysteine or homphenylalanine (needle); naphthalene (circle), spirocyclic (open circle), dihalogenated phenylalanine (diamond), leucine/leucine-like (square) and others (open square).

