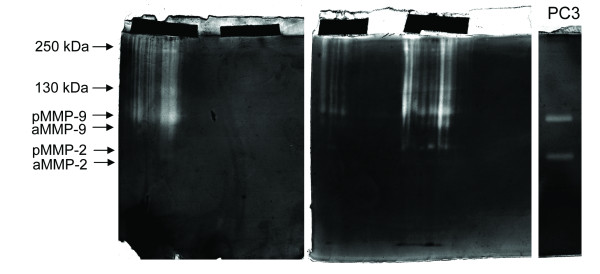
Figure 2.
Zymogram analysis of biopsy prints. Two exemplificative gels, each one containing two tissue prints visible as dark strips in the stacking gel, are shown. The presence of discrete gelatinolytic activity is indicated on the left with the molecular weight or with the corresponding gelatinase. On the right the gelatinolytic pattern observed in conditioned medium from PC3 cells.

